FIGURE SUMMARY
Title

Imaging of Neural Ensemble for the Retrieval of a Learned Behavioral Program

Authors
Aoki, T., Kinoshita, M., Aoki, R., Agetsuma, M., Aizawa, H., Yamazaki, M., Takahoko, M., Amo, R., Arata, A., Higashijima, S.I., Tsuboi, T., and Okamoto, H.
Source
Full text @ Neuron

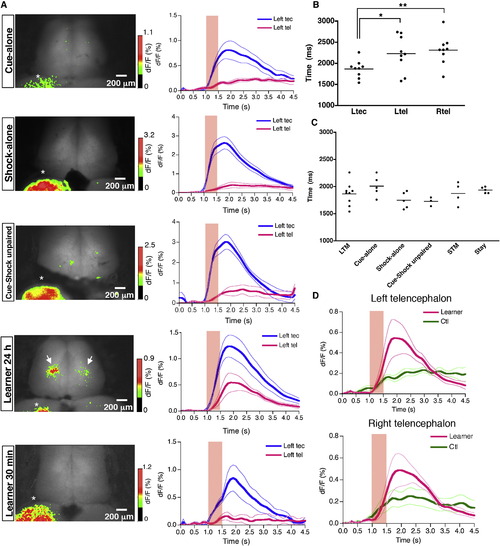
Calcium Signals Encoding Memory Retrieval in Zebrafish Telencephalon (A) Left: example of individual activity pattern for each experimental group. The image was taken at 1 s after the cue presentation. Star indicates the activity in the optic tectum. Arrows indicate the activity spots in the telencephalon specific to the learner fish 24 hr after the training. Right: averaged temporal sequence of fluorescence change of each experimental group in the left optic tectum (blue line, Left tec) and the left telencephalon (pink line, Left tel). The mean ± SEM is plotted. The cue presentation period was indicated with a red shadowed box. Cue-alone, n = 6; shock-alone, n = 4; cue-shock unpaired, n = 5, learner 24 hr, n=7; learner 30 min, n=4. (B) Comparison of the average of the peak time for left tectum (Ltec), left telencephalon (Ltel), and right telencephalon (Rtel) in the learner group. The peak times in the left (2,228 ± 401 ms) and right (2,313 ± 328 ms) telencephalon are significantly later than that in the left tectum (1,864 ± 197 ms). *p < 0.05, **p < 0.01, unpaired t test. There was no significant difference between the peak times in the left and right telencephalon. p = 0.6516, unpaired t test. (C) Comparison of the average of the peak time for left tectum in all experimental conditions including stay task (see Figure 5). LTM, learner imaged 24 hr after the last training; STM, learner imaged 30 min after the last training. LTM (1,864 ± 197 ms) versus cue-alone (2,008 ± 170 ms), p = 0.2308, unpaired t test. LTM versus shock-alone (1,748 ± 135 ms), p = 0.2993, unpaired t test. LTM versus cue-shock unpaired (1,726 ± 65 ms), p = 0.3052, unpaired t test. LTM versus STM (1,875 ± 179 ms), p = 0.9346, unpaired t test. LTM versus stay (1,936 ± 49 ms), p = 0.3604, unpaired t test. (D) Comparison of the averaged temporal sequence of fluorescence change of the telencephalon between the cue-alone group (green line) and the learner group (pink line). The mean ± SEM is plotted. The cue presentation period is indicated with a red shadowed box. See also Movies S3, S4, and S5 and Figure S2.

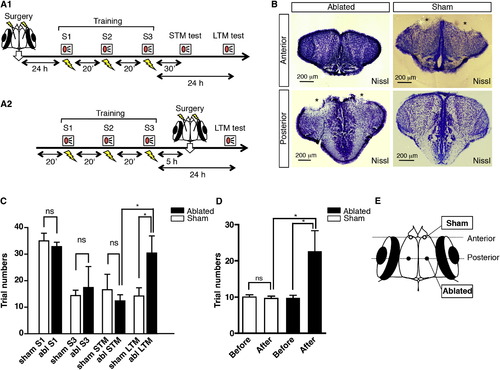
Lesion of Activated Areas Impairs Retrieval of the Long-Term Stored Avoidance Behavior (A1) Experimental schedule for the ablation before training. On the first day, fish underwent the surgery and were kept overnight for the recovery. On the second day, fish were trained in active avoidance learning as described. The short-term memory (STM) was tested 30 min after the last training session and the long-term memory (LTM) was tested 24 hr after the last training. S1, session 1; S2, session 2; S3, session 3. (A2) Experimental schedule for the ablation after training. Fish were first trained in active avoidance learning as described. Surgery was then conducted at 5 hr after the last training, and a retention test was performed 24 hr after the last training. (B) Representative examples of the activated area-ablated and sham-operated individuals. Section level is indicated in (E). Anterior (sham-operation-level) and posterior (the activity spot-level) sections with Nissl staining are shown in coronal view. Stars indicate the ablated sites. (C) The ablation before training does not affect the acquisition of the learning and STM but does affect the LTM. Columns and bars represent the mean ± SEM, respectively. Sham, n = 5; abl, n = 5. The average trial numbers required to achieve the learning criterion were 35 and 32.8 for sham S1 and abl S1, 14.4 and 17.4 for sham S3 and abl S3, 16.6 and 12.4 for sham STM and abl STM, and 14.2 and 30.4 for sham LTM and abl LTM. Sham S1 versus abl S1, p = 0.2642, unpaired t test. Sham S3 versus abl S3, p = 0.3659, unpaired t test. Sham STM versus abl STM, p = 0.2604, unpaired t test, sham LTM versus abl LTM, *p < 0.05, unpaired t test. abl STM versus abl LTM, *p < 0.05, sham STM versus sham LTM, p = 0.3641, unpaired t test. abl, ablated. (D) The effect of ablation at 24 hr after training on the retrieval of the avoidance behavior. Columns and bars represent the mean ± SEM, respectively. Sham, n = 8; abl, n = 14. The average trial numbers required to achieve the learning criterion were 10 and 9.6 before and after the sham procedure, respectively, and 9.6 and 23.6 before and after ablation, respectively. Sham before versus sham after, p = 0.35, paired t test. Ablated before versus ablated after, *p < 0.05, paired t test. Sham after versus ablated after, *p < 0.05, unpaired t test. (E) Schematic map for the ablation sites. Black circles indicate activity spot ablation sites. White circles indicate sham-operated ablation sites. For calculation of the site, see Experimental Procedures.See also Figure S3.

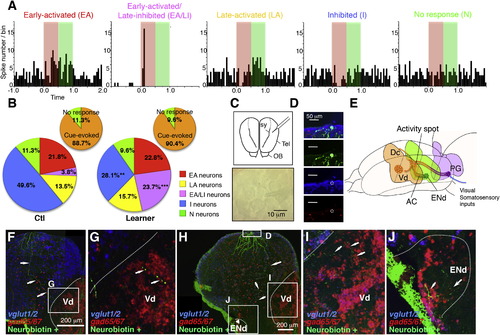
Electrophysiological, Morphological, and Neurochemical Profiling (A) Representative neural activity for each response class of neuron. A red shadow indicates the 500 ms cue presentation period. A green shadow indicates the following 500 ms postcue presentation period used for the analysis. (B) Learning-dependent changes in the proportion of each type of neurons. The proportion of EA/LI neurons was significantly larger in learner fish (p < 0.001***, χ2 test). The proportion of I neurons was significantly smaller in learner fish (p < 0.01**, χ2 test). EA neurons, ctl, n = 30, learner, n = 26; EA/LI neurons, ctl, n = 5, learner, n = 15; LA neurons, ctl, n = 18, learner, n = 18; I neurons, ctl, n = 65, learner, n = 32; N neurons, ctl, n = 15, learner, n = 11. (C) The recording site was lateral to sy and within the activated area (see Experimental Procedures). Tel, telencephalon; OB, olfactory bulb. Scale bar indicates 10 μm. (D) Cell body of neuron in (G) (the square region indicated as D) showing expression of vglut 1,2.1, 2.2 (blue) but not gad 65,67 (red). Scale bar indicates 50 μm. (E) Schematic diagram showing the connection of the activated area in the dorsal telencephalon with other parts of the brain based on single-cell tracing studies and bulk labeling. The activity spot receives the visual and/or somatosensory inputs from the PG. It projects to the Vd, the presumptive striatum in teleosts, and also toward the contralateral hemisphere passing by the ENd and extending into the AC. There are reciprocal projections between the activated area and the ENd as well as the PG, indicated by bidirectional arrows. See Supplemental Information for details of the tracing study. Anterior is to the left. Dorsal is toward the top. (F) An example of a labeled neuron (green) projecting to the dorsal nucleus of the ventral telencephalic area (Vd). Arrows show the trajectory of the projecting axon-like structure. The cell body was inadvertently removed during histochemistry processing. Scale bar indicates 200 μm. (G) Magnified view of the square region in (F) (indicated as G) showing the extended projection within the Vd. vglut 1,2.1, 2.2 (blue) and gad 65,67 (red) were costained by in situ hybridization. Arrows show the terminated axon-like projection within the Vd (outlined with a white dotted line). (H) Example of a labeled neuron (green) projecting toward the entopeduncular nucleus dorsal part (ENd) as well as the Vd. Arrows indicate the putative axonal projection and an arrowhead indicates the extended projection within the ENd. vglut 1,2.1,2.2 (blue) and gad 65,67 (red) were costained by in situ hybridization. Scale bar indicates 200 μm. (I) Higher magnification of the square region in (H) (indicated as I) around the Vd. The arrows show the bifurcated axon branches entering the Vd region. A white dotted line outlines the Vd. (J) Higher magnification of the square region in (I) (indicated as J) around the ENd. The arrows show the passing by axonal projection. A white dotted line outlines the ENd. See also Figure S4.

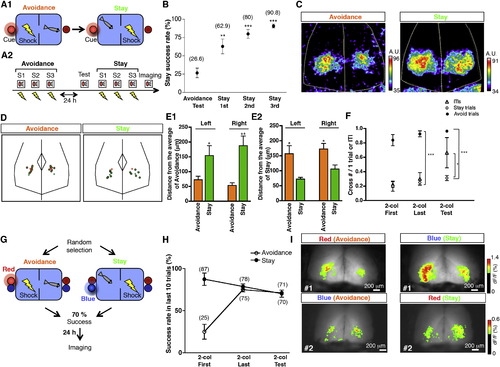
Zebrafish Learn and Encode the Behavioral Rule Change (A1) In the original active avoidance paradigm (avoidance task), fish had to swim into the other compartment to avoid the punishment upon the cue presentation. After a change in the learning contingency (stay task), fish had to stay in the same compartment with the cue turned on to avoid the punishment. (A2) Experimental schedule. On the first day, fish were trained for the avoidance task. Then, at 24 hr after the last training, fish were first tested for their retrieval of the avoidance behavior trained in the avoidance task, rested for 20 min, and then trained for the stay task. Imaging was performed 30 min after the last stay training. (B) The percentage of successful trials for stay training out of the total trial numbers was plotted as stay success rate (percentage). Dots and bars represent the mean ± SEM, respectively. Stay success rate increased as stay training sessions were repeated and reached over 80% after three sessions. The stay success rate averages were as follows: avoidance test = 26.6%, stay first session = 62.9%, stay second session = 80%, stay third session = 90.8%. n = 6. Statistical analysis was performed by repeated-measures one-way ANOVA and Bonferroni’s multiple comparison test. Avoidance test versus stay 1st, **p < 0.01; avoidance test versus stay 2nd, ***p < 0.001; avoidance test versus stay 3rd, ***p < 0.001. Stay 1st: stay task first session, stay 2nd: stay task second session, stay 3rd: stay task third session. (C) Representative individual activity maps for the avoidance and stay task memory retrieval. The activity pattern for stay is broader than for avoidance. (D) Distribution of the activity centers of individuals trained in the schedule as in (A2). Orange circles indicate activity centers for the avoidance task (n = 7) and green circles indicate activity centers for the stay task (n = 6). The orange and green crosses indicate the average points for the avoidance and stay activity centers, respectively. (E1 and E2) Avoidance task clusters of activity centers calculated from individuals trained in the schedule as in (A2) are significantly shifted from stay task clusters. Columns and bars represent the mean ± SEM, respectively. Avoidance task, n = 7; stay task, n = 6. (E1) Distances from the average point of the activity centers for the avoidance task to each activity center for the avoidance task and stay task were calculated for each hemisphere. *p < 0.05 and **p < 0.01, unpaired t test. (E2) Distances from the average point of activity centers for the stay task to each activity center for avoidance task and stay task were calculated for each hemisphere. *p < 0.05, unpaired t test. (F) Number of crossing the hurdle during two-color conditioning and test was plotted (cross-number/1 trial or ITI). Dots and bars represent the mean ± SEM, respectively. n = 8. *p < 0.05, ***p < 0.001, two-way ANOVA, Bonferroni’s post test. 2-col first, two-color conditioning first training session; 2-col last, two-color conditioning last training session; 2-col Test, two-color conditioning test session. The open triangle indicates cross-numbers during ITIs, the open circle indicates cross-numbers during stay task trials, and the filled circle indicates cross-numbers during avoidance task trials. (G) In two-color conditioning paradigm, the main program randomly selects one of the two tasks, avoidance and stay tasks. When the success rate becomes above 70% for both tasks, the training was stopped. Twenty-four hours after the last training, the calcium imaging was performed. Either of red LED-avoidance task/blue LED-stay task contingency or blue LED-avoidance task/red LED-stay task contingency was adopted. The same contingency was applied to one fish throughout the training period. (H) The percentage of successful trials for each task in last ten trials. Open circle indicates the percentage of avoidance and the black filled circle indicates the percentage of stay. Circles and bars represent the mean ± SEM, respectively. The success rate averages were avoidance first training = 25%, stay first training = 87.3%, avoidance last training = 75%, stay last training = 78.7%, avoidance test = 71.1%, and stay test = 70.2%. n = 8. (I) The representative activity pattern for each contingency. Fish 1 was trained with red LED-avoidance task/blue LED-stay task contingency. Fish 2 was trained with blue LED-avoidance task/red LED-stay task contingency. Scale bars indicate 200 μm. See also Figure S5 and Movie S6.

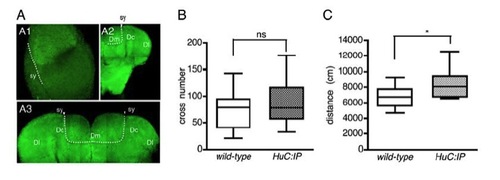
(A) Expression of inverse pericam (IP) in the telencephalon of adult HuC:IP transgenic fish.
(A1) Dorsal view of the right hemisphere. The midline to the left and anterior to the top. Dotted line indicates the position of the sulcus ypsilonformis (sy). The region lateral to sy is brighter than the medial part. The anterior half region is also brighter than the posterior half region.
(A2) Coronal view of the right hemisphere. The midline to the left and dorsal to the top. Arrowhead indicates sy. Dotted line indicates the border of the medial zone of the dorsal telencephalon (Dm). The intensity of IP expression in the region medial to the sy corresponding to Dm is less bright than the other parts that encompass the central and lateral zones of the dorsal telencephalon (Dc and Dl).
(A3) Magnified image of (A2). Arrowheads indicate sy. Dotted line indicates the border of Dm. The IP expression was lower in Dm (arrows) than other regions of the dorsal telencephalon.
(B, C) Swimming behavior of HuC:IP transgenic fish. (B) The number of crossing the hurdle during the adaptation period in the first training session was not significantly different between wild-type and HuC:IP transgenic groups. P=0.2046, unpaired t-test, N=26. ns, not significant.
(C) HuC:IP fish showed a slight increase in swimming distance during the adaptation period in the first training session compared to wild types. *P<0.05, unpaired t-test, N=13.

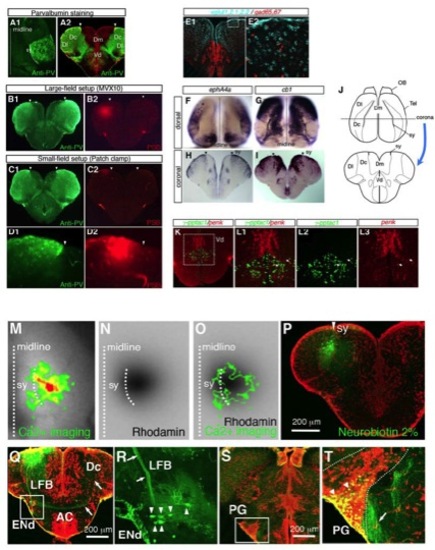
(A-D) The activated areas observed in the large-field and the small-field imaging setups coincide.
(A1, A2) Parvalbumin (PV) immunohistochemistry of wild-type fish. Dorsal view (A1) and coronal section (A2). Dotted line in (A1) and arrowheads in (A2) indicate the sy. Strong staining of PV was observed in the soma, in a very restricted area of the dorsal telencephalon lateral to sy, encompassing Dc and Dl.
(B1, B2) Labeling of the activated area by pontamine sky blue (PSB) in the large-field imaging setup, with co-staining of PV. PSB was injected into the activated area identified by calcium imaging (See Experimental Procedure). The PSB staining was found lateral to sy (arrowheads) within a strong PV-expressing area.
(C1, C2) Labeling of the activated area by PSB in the small-field imaging setup was found in the same area as labeling in the large-field setup, lateral to sy (arrow heads) within a strong PV-expressing area.
(D1, D2) Magnified view near the injection site of PSB in E and F. PSB staining is restricted within a strong PV-expressing area lateral to sy (arrowheads).
(E-L)Zebrafish telencephalon expresses genes that are expressed in the mammalian cortex and striatum.
(E1, E2) Expression of vglut1,2.1,2.2 (blue) and gad65,67 (red) was analyzed by two-color fluorescent in situ hybridization in zebrafish telencephalon. E2 shows a close-up view of the square region in E1. Note that neurons in the dorsal telencephalic area are mainly glutamatergic (E1), although there were also some dispersed neurons expressing gad65/67 (E2). In contrast, neurons in the ventral telencephalon are mainly GABAergic, showing strong gad65/67 expression (E1).
(F-I) Expression of ephA4a and cannabinoid receptor 1 (cb1) was analyzed by in situ hybridization in zebrafish telencephalon, examined at dorsal (F, G) and coronal (H, I) views. For the dorsal view, a 400-μm thick horizontal section of the dorsal-most telencephalon was processed for in situ hybridization. Straight and curved dotted black lines in F and G indicate the midline between two telencephalic hemispheres and the sulcus ypsilonformis (sy),respectively. Black arrowheads in H and I indicate the position of sy.
In zebrafish telencephalon, ephA4a, the zebrafish homolog for EphA4, is expressed in Dc and Dl (F, G). The border of ephA4a expression corresponds to the border between Dc and Dm, which is morphologically discernible by the sy fissure. Dm is devoid of ephA4a expression. In contrast, cb1, the zebrafish homolog for Cannabinoid receptor 1 (CB1) is expressed strongly in Dm and less in Dc and Dl (H, I). Again, the border of cb1 expression corresponds to sy. These expression patterns are consistent with the fact that mouse CB1 is expressed in the basolateral amygdala (Marsicano and Lutz, 1999; Katona et al., 2001; Marsicano et al., 2002) and mouse EphA4 is expressed in the cortical layer III/IV and the hippocampus (Greferath et al., 2002). (J) Schematic dorsal and coronal views of zebrafish telencephalon. OB, olfactory bulb; Tel, telencephalon; Dm, medial zone of the dorsal telencephalic area; Dc, central zone of the dorsal telencephalic area; Dl, lateral zone of the dorsal telencephalic area; Vd, dorsal nucleus of the ventral telencephalic area. (K-L) Expression of <γ-pptac1 (green) and penk (red) was analyzed by two-color fluorescent in situ hybridization in zebrafish telencephalon. Coronal view is shown. Magnified views of the square region in K are shown in L1-L3. Note that neurons expressing γ-pptac1 and penk are mostly separate in the Vd as in the mammalian striatum except for the rare (two) double-positive cells (L1-L3, white arrows).
(M-T) Tracing afferent and efferent connections of the activated area. (M-O) The activity spot was detected by large-field calcium imaging (M). The straight dotted line indicates the midline between two hemispheres. The curved dotted line indicates sy. The tracer-injected site was confirmed by the rhodamine fluorescence (N) overlapping with the activity spot (O).
(P) Coronal section at the injection site, located lateral to sy (arrowhead). Scale bar indicates 200 μm.
(Q, R) Anterograde tracing of the activity spot revealed that axons from the activity spot formed a lateral forebrain bundle (LFB, arrows in R) and passed by the ENd. Retrogradely labeled large cell bodies within the ENd were also observed (arrowheads in R). After passing by the ENd, the projection extended into the anterior commissure (AC), reaching the contralateral hemisphere (arrows in Q). Scale bar in Q indicates 200 μm.
(S, T) Retrogradely labeled cell bodies (arrowheads in T) were observed in the midbrain multisensory relay nucleus, the preglomerular nucleus (PG, dotted line). There were also some fibers located medially to the PG (an arrow in T). Scale bar in S indicates 200 μm.

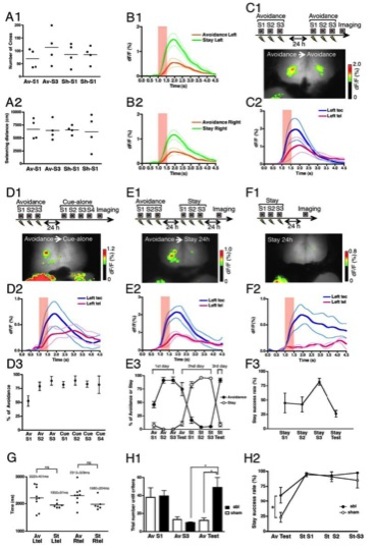
(A1, A2) Behaviors of fish which were trained by the Avoidance task then exposed to the electric shocks alone during adaptation periods.
(A1) The number of crossing the hurdle during 20-minute adaptation periods before each session did not change between Avoidance and Shock-alone sessions.
(A2) The swimming distances during 20-minute adaptation periods before each session did not change between Avoidance and Shock only sessions. Av-S1: Avoidance-training session 1, Av-S3: Avoidance-training session 3, Sh-S1: Shock-alone session 1, Sh-S3: Shock-alone session 3.
(B) Time course analysis of calcium signals for Avoidance and Stay task memory retrieval. The mean +/- SEM was plotted.
(B1) Time course of calcium signals in the left telencephalon for Avoidance (orange) and Stay (green) task memory retrieval. Avoidance task, N=7; Stay task, N=6.
(B2) Time course of calcium signals in the right telencephalon for Avoidance (orange) and Stay (green) task memory retrieval. Avoidance task, N=7; Stay task, N=6.
(C-F) Control experiments for Avoidance task-then-Stay task conditioning.
(C1) (Above) Experimental schedule. Fish were trained by three sessions of the Avoidance task on the first day then by three sessions of Avoidance task again on the second day. (Below) An example of the calcium activity pattern of the fish which was trained by the Avoidance task twice.
(C2) Averaged temporal sequence of fluorescence change in the left optic tectum (blue line, Left tec) and the left telencephalon (pink line, Left tel). The mean +/- SEM is plotted. The cue presentation period was indicated with a red shadowed box. N=3.
(D1) (Above) Experimental schedule. Fish were trained by three sessions of the Avoidance task on the first day then by four sessions of the cue-alone exposure on the second day. (Below) An example of the calcium activity pattern of the fish which was trained by the Avoidance task then proceeded to the Cue-alone sessions.
(D2) Averaged temporal sequence of fluorescence change in the left optic tectum (blue line, Left tec) and the left telencephalon (pink line, Left tel). The mean +/- SEM is plotted. The cue presentation period was indicated with a red shadowed box. N=3.
(D3) The percentage of the avoidance response in each session. Dots and bars represent the mean +/- SEM, respectively. Even after four cue-alone sessions, the acquired avoidance responses were not extinguished. Av S1: Avoidance training session 1, Av S2: Avoidance training session 2, Av S3: Avoidance training session 3, Cue S1: Cue-alone session 1, Cue S2: Cue-alone session 2, Cue S3: Cue-alone session 3, Cue S4: Cue-alone session 4. N=4.
(E1) (Above) Experimental schedule. Fish were trained by the Avoidance task on the first day, then trained by the Stay task on the next day and tested 24 h after the last Stay conditioning. (Below) In fish trained by the Avoidance task first then by the Stay task, the calcium activity pattern in the telencephalon at 24 h was similar to that observed in fish trained by the Avoidance task alone at 24 h.
(E2) Averaged temporal sequence of fluorescence change in the left optic tectum (blue line, Left tec) and the left telencephalon (pink line, Left tel). The mean +/- SEM is plotted. The cue presentation period was indicated with a red shadowed box. N=4.
(E3) Dots and bars represent the mean +/- SEM, respectively. The success rate for the Avoidance task increased during Avoidance task training on the first day, then decreased during Stay task training on the second day, and recovered in the test session on the third day. The percentage for the Stay behavior remained low during Avoidance task on the first day, then increased during Stay task training on the second day. This high rate for the Stay behavior was not maintained on the third day. Av-S1: Avoidance task training session 1, Av-S2: Avoidance task training session 2, Av-S3: Avoidance task training session 3, Av-test: Avoidance task test session, St-S1: Stay task training session 1, St-S2: Stay task training session 2, St-S3: Stay task training session 3, St-test: Stay task test session. N=5.
(F1)(Above) Experimental schedule. Fish were trained by the Stay task and tested 24 h later. (Below) At 24 h after the Stay training, there was no apparent localized calcium signal in the telencephalon.
(F2) Averaged temporal sequence of fluorescence change in the left optic tectum (blue line, Left tec) and the left telencephalon (pink line, Left tel). The mean +/- SEM is plotted. The cue presentation period was indicated with a red shadowed box. N=2.
(F3) Dots and bars represent the mean +/- SEM, respectively. Although the success rate in the Stay task increased during the Stay training, this high success rate for the Stay task was not maintained 24 h after. Stay S1: Stay task training session 1, Stay S2: Stay task training session 2, Stay S3: Stay task training session 3, Stay test: Stay task test session. N=4.
(G) Peak time comparison. The comparison of the peak times between the curves of calcium signals of Avoidance and Stay task in the left and right telencephalon. There was no significant difference between the peak times of the Avoidance and Stay task in both telencephalic hemispheres (Left telencephalon, P=0.0931, unpaired t-test; Right telencephalon, P=0.0599, unpaired t-test). Av Ltel: Avoidance left telencephalon, Av Rtel: Avoidance right telencephalon, St Ltel: Stay left telencephalon, St Rtel: Stay right telencephalon.
(H) Ablation between the Avoidance task and the Stay task. In order to examine whether the Stay task learning is dependent on the Avoidance neural ensemble, we first trained fish by the Avoidance task then ablated the activated region, then trained them by the Stay task on the next day.
(H1) The activated area ablated fish showed the impairment of the memory 24 hours after the last conditioning. Columns and bars represent the mean +/- SEM, respectively. abl: ablated fish (black filled bar, N=4), sham: sham operated fish (white bar, N=3). Av S1: Avoidance conditioning session 1, Av S3: Avoidance conditioning session 3, Av Test: Avoidance conditioning test session. Av S3 abl vs. Av Test abl; P*<0.05, Paired t-test. Av S3 sham vs. Av Test abl; P*<0.05, Unpaired t-test.
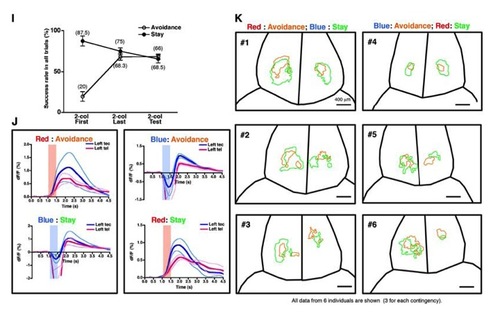
(H2) Circles and bars represent the mean +/- SEM, respectively. The higher Stay rate in the ablated fish in comparison with that in the sham operated fish reflects the memory impairment in the Avoidance test session. However, in the subsequent Stay conditioning, the success rate was not different between ablated fish (abl, black filled circle, N=4) and sham operated fish (sham, white open circle, N=3). Av test abl vs. Av test sham; P*<0.05, two-way ANOVA. (I-K)Two-color conditioning.(I) Behavioral outcomes of all trials for first, last and test session of two-color conditioning. Circles and bars represent the mean +/- SEM, respectively. The Avoidance success rateincreases when the conditioning session advances. The Stay success rate decreases because the fish stop to show the freezing when the conditioning session advances. This overall tendency is not different from Figure 5H which shows behavioral outcomes of the last 10 trials for first, last and test session of two-color conditioning. N=8.
(J) Averaged temporal sequence of fluorescence change in the left optic tectum (blue line, Left tec) and the left telencephalon (pink line, Left tel). The mean +/- SEM is plotted. The cue presentation period was indicated with a red or blue shadowed box depending on the cue color. The large dips of the signals by the blue LED light exposure were artifacts because the blue LED light passed through the green filter (see Full Experimental Procedures). N=3 for each contingency.
(K)Traces of activated area for Avoidance and Stay task memory retrieval. Traces of activated area corresponding to the retrieval of the Avoidance (orange line) and Stay (green line) task memory were drawn in the outlined telencephalic area of each individual. Fish #1-#3 were trained by red LED-Avoidance task/ blue LED-Stay task contingency and fish #4-#6 were trained by blue LED-Avoidance task/ red LED-Stay task contingency. Scale bar indicates 400 μm.

Acknowledgments
This image is the copyrighted work of the attributed author or publisher, and ZFIN has permission only to display this image to its users. Additional permissions should be obtained from the applicable author or publisher of the image. Full text @ Neuron