- Title
-
Regeneration of amputated zebrafish fin rays from de novo osteoblasts
- Authors
- Singh, S.P., Holdway, J.E., and Poss, K.D.
- Source
- Full text @ Dev. Cell
|
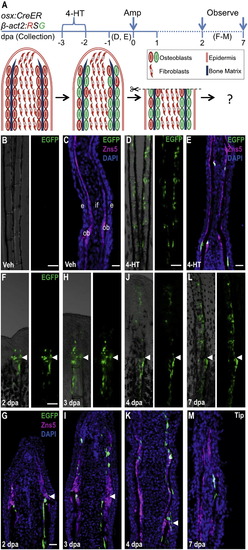
Resident Osteoblasts Contribute New Osteoblasts to Regenerating Fin Structures (A) Cartoon summarizing strategy for inducible, genetic fate mapping of osteoblasts during zebrafish fin regeneration. 4-HT treatment labels osterix-expressing cells with EGFP prior to amputation. (B and C) Uninjured osx:CreER; β-act2:RSG fins, shown as whole mount (B) and in a longitudinal section (C), display no labeling after vehicle treatment. Zns5 (magenta) is an uncharacterized antigen that helps identify osteoblasts lining hemiray bone (Johnson and Weston, 1995). This antibody stains cell membranes and visualizes as noncontiguous staining in sections. (C) The longitudinal fin section is labeled to show structures: intraray fibroblasts (if), osteoblasts (ob), and epidermis (e). (D and E) 4-HT treatment labels many osteoblasts with EGFP in uninjured fins, shown as a whole-mount image (D) and a longitudinal section (E). (F?M) EGFP+ osteoblasts labeled by 4-HT treatment prior to fin amputation contribute labeled progeny to the regenerate, visualized by whole-mount images and in sections at 2 (F and G), 3 (H and I), 4 (J and K), and 7 (L and M) dpa. EGFP fluorescence proximal and distal to the amputation plane is restricted to the osteoblast compartment and is not present in intraray fibroblasts or epidermis. Arrowheads indicate the plane of amputation. Scale bars = 100 μm. See Figure S1. |
|
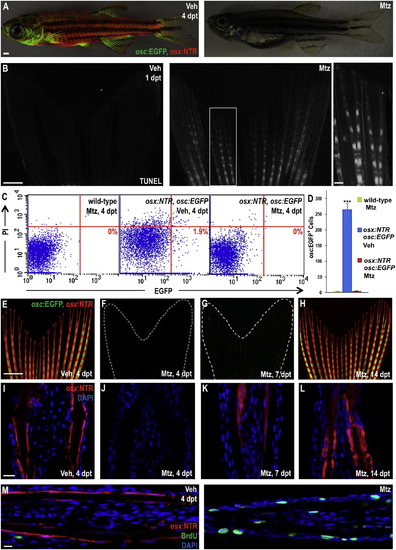
Inducible Ablation and Recovery of Adult Zebrafish Osteoblasts (A) Juvenile osx:NTR; osc:EGFP fish treated with vehicle (left) or Mtz (right) and assessed for fluorescence 4 days later. There was no detectable marker expression in Mtz-treated animals. Scale bar = 1 mm. (B) TUNEL staining of osx:NTR fins 24 hr after vehicle (left) or Mtz (right) treatment, indicating profound, osteoblast-specific apoptosis (white) in Mtz-treated fish. Higher magnification images are shown in Figure S2. Scale bar = 100 μm. (C) Flow cytometric analysis of caudal fin cells from wild-type (nontransgenic) and osx:NTR; osc:EGFP fish treated with vehicle or Mtz. Single cell suspensions were stained with propidium iodide (PI) and analyzed for EGFP. Representative plots are shown in (C); numbers in the lower right box indicate relative percentages of osc:EGFP+ cells. (D) Absolute osc:EGFP cell counts (per 10,000 cells) from data in (C). Data are mean ± SEM from nine animals each. ***p < 0.001, Student′s t test. Wild-type and Mtz-treated osx:NTR; osc:EGFP samples show no significant difference in osc:EGFP+ cells, indicative of complete osteoblast loss. (E?H) Caudal fins of osx:NTR; osc:EGFP fish lose osteoblast fluorescence within 4 days of Mtz treatment (E and F). Expression of osx:NTR can be detected beginning at 7 days posttreatment (dpt) (G), more easily in tissue sections than whole-mount images. Expression recovers completely by 14 dpt (H). Scale bar = 1 mm. (I?L) Longitudinal sections of osx:NTR fins at time points indicated in (E)?(H). osx:NTR fluorescence disappears by 4 dpt and recovers in the osteoblast compartment by 14 dpt. Scale bar = 100 μm. (M) BrdU immunofluorescence (green) analysis of vehicle- (left) or Mtz-treated (right) osx:NTR animals 4 days posttreatment, indicating enhanced cellular DNA synthesis in Mtz-treated samples. Scale bar = 100 μm. See Figure S2. |
|
Osteoblast-Depleted Fins Regenerate Normally after Amputation (A) Cartoon summarizing strategy to assess regeneration of amputated fins after genetic ablation of osteoblasts. (B) Lengths of fin regenerates after osteoblast ablation and amputation. As a negative control, wild-type animals were treated with Mtz 2 days before amputation and 4 days after amputation (wild-type, Mtz). osx:NTR animals treated with vehicle (osx:NTR, Veh) or Mtz (osx:NTR, Mtz) prior to amputation regenerated fins with similar efficacy. Data are mean ± SEM from 15 animals each. (C and D) osx:NTR; osc:EGFP animals had indistinguishable regenerative lengths at 4 dpa whether or not osteoblasts were present prior to amputation, and indistinguishable osterix-driven expression in the regenerate. Osteoblast depletion proximal to the amputation plane is evident in Mtz-treated animals by the absence of marker expression (D; bracket). Bottom images show osx:NTR fluorescence only. Arrowheads indicate the plane of amputation. Scale bar = 100 μm. (E?P) Whole-mount views and longitudinal sections of fins at 2 (E?H), 3 (I?L), and 4 (M?P) dpa, highlighting osterix-driven NTR fluorescence. osx:NTR is undetectable below the amputation plane of fins from Mtz-treated animals at 3 and 4 dpa, except for a trail of fluorescent cells at the amputation site. Tissue sections indicate expression of osx:NTR in osteoblasts at each of the 3 time points, and ectopic osx:NTR fluorescence in intraray fibroblasts at 4 dpa in the Mtz treated group (asterisk in P). Dotted lines and arrowheads indicate the plane of amputation. Scale bar = 100 μm. See Figure S3. |
|
New Osteoblasts Arise in the Regenerates of Osteoblast-Depleted Fins through De Novo Differentiation (A) Cartoon depicting strategy that combines inducible lineage tracing and cell ablation in the osx:CreER; β-act2:RSG; osx:NTR background. 4-HT treatment imparts a β-actin2-driven EGFP label in osteoblasts. (B and C) 4-HT labels osteoblasts of uninjured fins with EGFP fluorescence (B). This label was undetectable after Mtz treatment (C), indicating efficient osteoblast ablation. (D) After amputation of fins of 4-HT-labeled and Mtz-treated animals, EGFP label was not detectable in 4 dpa regenerates or portions of the fins proximal to the injury site. Because the label was driven by the β-actin2 promoter, this result indicates that EGFP loss in (C) was due to cell ablation and not downregulation of an osteoblast marker. (E?G) A second 4-HT treatment at 2 dpa generated EGFP+ cells in 3, 4, and 7 dpa regenerates, but not in portions of the fins proximal to the injury site. This result indicates that, although β-actin2 expressing osteoblasts are not contributed by uninjured fin regions, the regenerated osteoblasts can still be labeled by EGFP via their expression of osx:CreER and β-act2:RSG after amputation. (H) Longitudinal section of uninjured fin corresponding to (C), indicating lack of EGFP fluorescence after 4-HT labeling and subsequent Mtz treatment. (I) Longitudinal section of 3 dpa regenerate corresponding to (E), indicating that EGFP fluorescence induced by a postamputation 4-HT label is present in the osteoblast compartment of the regenerated portion only. Scale bar = 100 μm. See Figure S4. |
|
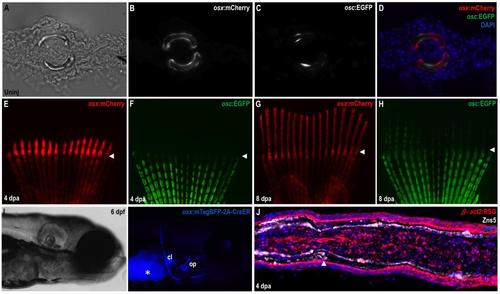
Osteoblast-Specific Transgenic Reporter and Lineage-Labeling Strains (A-D) Transverse section through an uninjured caudal fin from an osx:mCherry; osc:EGFP double transgenic animal. Fin hemirays are outlined by osx:mCherry+ osteoblasts, most of which are also positive for osc:EGFP fluorescence. (E-H) Regenerating fins of osx:mCherry; osc:EGFP animals shown at 4 (E, F) and 8 (G, H) dpa. osx:mCherry is easily visible in the regenerate by 4 dpa, while osc:EGFP fluorescence emerges at 7-8 dpa. Arrowheads indicate amputation planes. (I) Bright field (left) and fluorescent (right) images of a 6 dpf osx:CreER larva, indicating blue mTagBFP fluorescence in bone structures. Asterisk, yolk autofluorescence. cl, clethium; op, opercule. (J) Section through a 4 dpa β-act2:RSG fin regenerate. DsRed fluorescence is detectable in most cells, indicating that the line is suitable for genetic fate-mapping of fin tissues. |
|
Effects of Osteoblast Ablation (A) High magnification image of TUNEL staining of osx:NTR fins 24 hours after vehicle (left) or Mtz (right) treatment. TUNEL signals were not detected in vehicle-treated osteoblasts, while only osx:NTR+ cells displayed TUNEL staining after Mtz treatment. Note that osteoblasts show an atypical rounded appearance 24 hours after Mtz treatment, as well as perinuclear/cytosolic TUNEL staining similar to what that reported for cardiomyocytes after diphtheria toxin A-mediated ablation (Wang et al., 2011). Scale bar = 100 μm. (B) Cranial images of osx:NTR; osc:EGFP fish, showing major loss of osteoblast marker fluorescence within 4 days of Mtz treatment. Expression of osx:NTR is undetectable, while very low green fluorescence can be detected. Autofluorescence may be a factor due to a higher exposure time than Figure 2A. osx:NTR and osc:EGFP signals show recovery at 7 and 14 days post-treatment (dpt). (C) Hypurals 3, 4 and 5 (Hy3-5) of adult osx:NTR; osc:EGFP fish were imaged after fixation and complete removal of overlying tissues. Dramatic loss of fluorescent reporters occurs by 4 days after Mtz treatment, while recovery is evident at 7 and 14 dpt. (D) BrdU was injected into osx:NTR animals 4 days after Mtz treatment. Tissue is co-stained with p63 (magenta), which marks basal epidermal cells. Proliferating epidermal cells (arrowhead) and non-epidermal cells (arrow) are evident in the absence of detectable osteoblasts, indicating a diverse cellular proliferative response to the ablation. |
|
Induction of the Early Osteoblast Marker runx2a in the Regenerate after Ablation (A) osx:NTR animals treated with vehicle before amputation and with Mtz 4 days after amputation (post-amp Mtz) display a slower rate of regeneration as compared to those treated with Mtz 2 days before amputation (Mtz). An additional control group, showing normal regeneration and not indicated on this graph, was wild-type animals treated with Mtz 2 days before amputation and 4 days after amputation (see Figure 3B). These data indicate that osteoblast ablation during regeneration slows the process. Data are mean ± SEM from 15 animals each. ***p < 0.001, Student?s t-test. (B, C) Images of 8 dpa osx:NTR; osc:EGFP fin regenerates treated with Mtz at 2 days before amputation (B) or at 4 dpa (C). Post-amputation treatment slows regeneration. osx:NTR fluorescence is strong in the 8 dpa regenerate from the post-amputation Mtz group, but not yet detectable in the uninjured portions proximal to the amputation plane (bracket in (C)). Arrowheads indicate amputation plane. Scale bar = 100 μm. (D) Lengths of regenerates at 30 dpa from different treatment regimens are similar, indicating that pre- or post-amputation ablation of osteoblasts does not alter the correct recovery of proximodistal length. Data are mean ± SEM from 15 animals each. (E, F) Longitudinal sections of 2, 3, and 4 dpa fin regenerates indicating runx2a (E) and osx (F) mRNA expression. runx2a and osx is detected both proximal and distal to the amputation plane (dotted lines) in osx:NTR fish treated with vehicle prior to amputation (left panels for each marker in E, F). By contrast, after treatment with Mtz to ablate osteoblasts prior to amputation (right panels), runx2a and osx are robust in the regenerate but undetectable in tissue proximal to the amputation plane. Additionally, osx expression is detected in intraray fibroblasts at 3 dpa regenerates of fins that had been depleted of osteoblasts prior to amputation (red bracket). Scale bar = 100 μm. |
Reprinted from Developmental Cell, 22(4), Singh, S.P., Holdway, J.E., and Poss, K.D., Regeneration of amputated zebrafish fin rays from de novo osteoblasts, 879-886, Copyright (2012) with permission from Elsevier. Full text @ Dev. Cell


