- Title
-
RNA profiling of FAC-sorted neurons from the developing zebrafish spinal cord
- Authors
- Cerda, G.A., Hargrave, M., and Lewis, K.E.
- Source
- Full text @ Dev. Dyn.
|
GFP expression and FAC sorting of Tg(pax2a:GFP) and Tg(elavl3:EGFP) embryos. A: Lateral views of GFP antibody staining (in green) in Tg(elavl3:EGFP) and Tg(pax2a:GFP) trunks at 27 hpf. The edges of the embryos are depicted as white lines. The region dissected from the embryos in our experiments is demarcated with red dotted lines. In this region, at this stage, the vast majority of spinal cord neurons that express GFP in Tg(pax2a:GFP) embryos are CiAs (see also Batista and Lewis,[2008]). White arrowheads in Tg(pax2a:GFP) indicate GFP expression in the pronephros. Scale bar (top left-hand corner of A) = 50 μm. B: Example of: side scatter (SSC) and forward scatter (FCS) measurements used to select a homogenous cell population (R1 area); FCS and pulse width measurements used to select single events (single cells) (R2 area); Propidium Iodide measurement for events from R1 and R2 areas, used to select live cells from the single cells (R3 area); bar chart showing the average percentage of dead cells (R4 area) among the cells from the R1 and R2 area (single cells) and from all events (labelled “Total”). C: Examples of GFP level measurements of single live cells (events present in all three of the R1, R2, and R3 areas) used to select and sort GFP-positive cells from Tg(elavl3:EGFP) and Tg(pax2a:GFP) embryos (R5 area). Trunk samples were selected from the R3 area (live single cells). Wild type (wt) cells were used to calibrate the FACS sorter and set the cut-off for determining the boundary of the R5 area. EXPRESSION / LABELING:
|
|
Expression profiles of control genes predicted to be differentially expressed between experimental groups. The relative expression profiles of seven transcripts are shown. These transcripts were predicted, based on previous studies, to be differentially expressed between the experimental groups (see main text for references). The gene name, major site of expression in the trunk region dorsal to the yolk extension at prim stage 10/11, and the corresponding Affymetrix probe set identifier are shown for each gene. A: Expression of two markers of CiA interneurons, pax2a and eng1b, show highest expression in the Tg(pax2a:GFP) experimental group relative to the other two groups. B: Markers of other, defined spinal interneurons show the highest relative expression in the Tg(elavl3:EGFP) experimental group and the lowest relative expression in the Tg(pax2a:GFP) experimental group. C: Two markers of developing myotome, myf5 and dystrophin (dmd), have the highest relative expression in the trunk group. Expression profiles depict normalised expression data from each gene transformed to a mean of zero and standard deviation of one with a colour scale of +1 standard deviation (red) to -1 standard deviation (blue) (www.gepas.org; Montaner et al.,[2006]). Any expression values originally further than ±1 standard deviation from the mean are shown as shown as ±1 standard deviation. Individual RNA samples for each group are numbered as in Table 1. The expression scale is in units of standard deviation. |
|
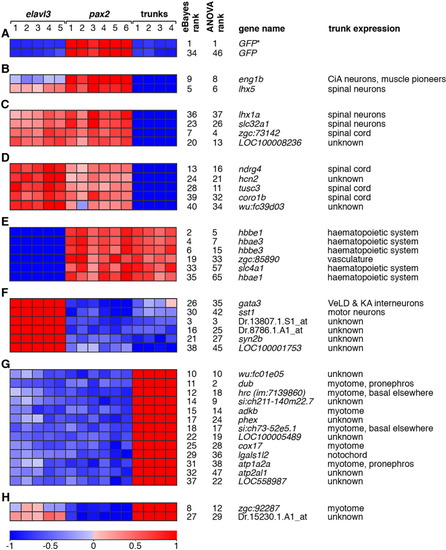
Expression profiles of highly ranked, differentially expressed transcripts. The relative expression profiles of the top 40 probe sets ranked by an eBayes-based test for differential expression are shown. Relative Expression profiles and experimental groups are depicted as in Figure 2 and, again, expression profiles are shown as normalised expression data transformed to a mean of zero and standard deviation of +1 (red) to -1 (blue). The following is shown for each probe set: the ranks in eBayes-based and ANOVA tests for differential expression; the corresponding gene name and known expression in the trunk region of interest (see main text for references). The probe sets are divided into eight subsets (A-H) based on relative expression between experimental groups and statistical evidence for differential expression between groups. For statistics for each comparison, see Supp. Table 1. This is also discussed in more detail in the Results section. Those probe sets without an associated gene name are labelled with the Affymetrix probe set identifier. The probe set labelled as GFP* (AFFX-Dr-AF292560-1_s_at) was originally designed against the cyan fluorescent protein (CFP) gene; however, the probes in this set have complete sequence identity with GFP and would hybridise to GFP transcripts, but not EGFP transcripts in this experimental context. The probe set labelled wu:fc39d03 (Dr.5151.1.A1_at) is called ptprn2l in the current version of the Affymetrix annotation of probe sets for the zebrafish GeneChip. However, the original target sequence of the probe set is not currently associated with a UniGene identifier. |
|
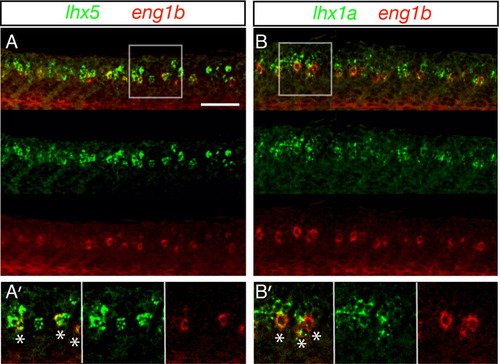
Zebrafish V1 cells (CiAs) express lhx1a and lhx5. Confocal microscopy lateral views of fluorescent double in-situ hybridization of wildtype embryos at 27 hpf. In all cases, merged images and single channel views are shown. A: Z stack projections of lhx5 expression in green, eng1b expression in red. A′: Single focal plane of white box in A, showing lhx5 and eng1b co-localization. B: Z stack projections of lhx1a expression in green, eng1b expression in red. B′: Single focal plane of white box in B, showing lhx1a and eng1b co-localization. White stars in A′ and B′ merged images indicate double-labelled cells. Scale bar = 50 μm (A, B). |
|
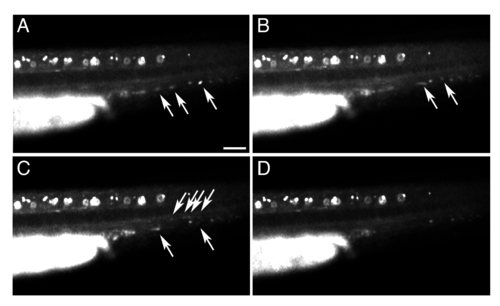
GFP expression in circulating blood cells in Tg(pax2a:GFP) embryos. Fluorescent microscopy images of a live, prim-11 stage (27 hpf) Tg(pax2a:GFP) embryo showing expression of GFP in circulating blood cells (arrows). The embryo was anaesthetised with tricaine and images were taken at consecutive time points (in order A, B, C, D) approximately one second apart. GFP-labelled blood cells can be seen moving posteriorly through the dorsal aorta and returning anteriorly through the posterior cardinal vein. The embryo is oriented with anterior to the left and dorsal up. Scale bar = 50 μm. |


