
|
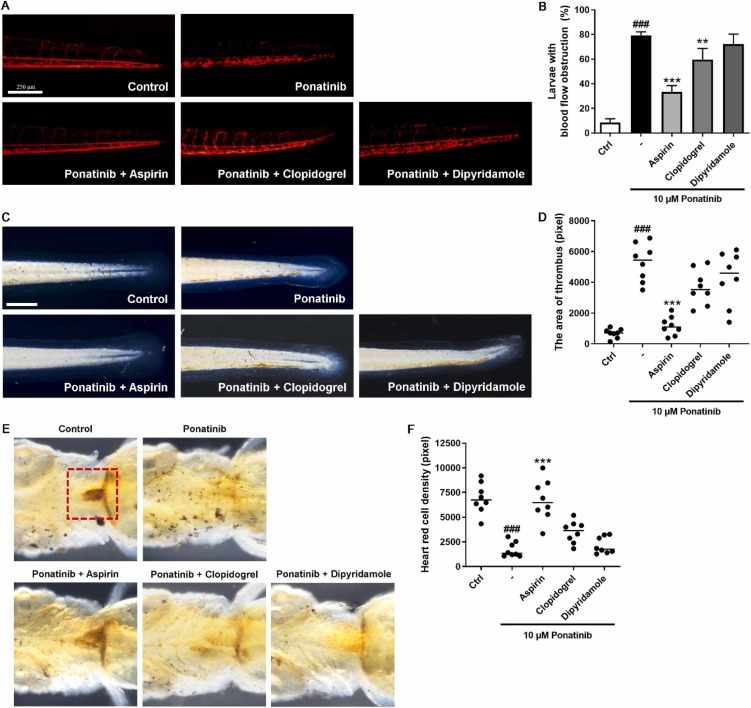
Fig. 5 The effects of anti-thrombotic drugs on Ponatinib-induced thrombosis in zebrafish larvae. (A) 1 dpf Tg (gata1: dsRed) transgenic zebrafish larvae were treated with 0.1 % DMSO or 10 ?M Ponatinib or co-treated with 10 ?M Ponatinib and 25 ?g/ml Aspirin or 25 ?g/ml Clopidogrel or 25 ?g/ml Dipyridamole for 3 days. The represented images of the blood flow in different groups. (B) The rate of blood flow stops in 15 fish/group batches. Data are represented as mean � SEM. ###P < 0.005 vs. control group; **P < 0.01 and ***P < 0.005 vs. Ponatinib group. (C) The represented images and (D) quantification of thrombus formation in different groups detected by the o-dianisidine staining (n=8). Data are represented as mean � SEM. ###P < 0.005 versus control group; ***P < 0.005 vs. Ponatinib group. (E) The erythrocytes (red colour) in heart was detected by the o-dianisidine staining. The area in the red dashed line square was measured by Image J (n=8). Data are represented as mean � SEM. ###P < 0.005 versus control group; ***P < 0.005 vs. Ponatinib group.