IMAGE

Fig. 1.

ID
ZDB-IMAGE-241125-22
Source
Figures for Noble et al., 2024
Image
Figure Caption

Fig. 1.

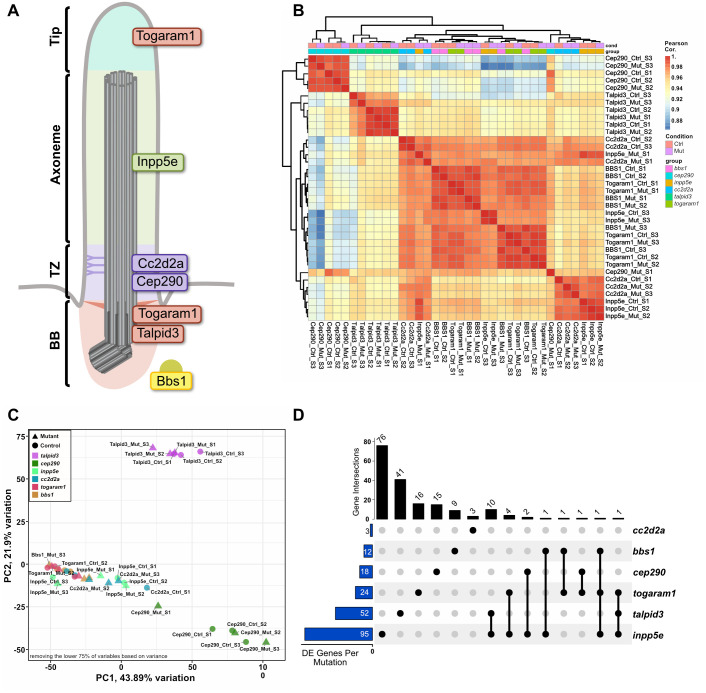
Transcriptomic comparison of zebrafish JBTS mutants. (A) Schematic of a cilium, outlining ciliary subcompartments [basal body (BB), transition zone (TZ), axoneme and tip]. The localisation of the proteins encoded by the genes studied here is indicated. Specifically, Togaram1 and Talpid3 are localised to the BB, with Togaram1 additionally translocating to the ciliary tip, Inpp5e is localised along the ciliary membrane and Cc2d2a and Cep290 are found at the TZ. Bbs1, not associated with JBTS, functions as part of the octameric protein complex BBSome. Whole larval bulk RNA sequencing at 3 dpf was performed on zebrafish mutants harbouring mutations in one of the depicted genes. All were maternal zygotic mutants (mz) except for talpid3. (B) Heat map of the Pearson correlation coefficients derived from regularised log-transformed gene counts, illustrating the overall high similarity between the different samples (correlation coefficients all above 0.88). The hierarchical clustering using average Euclidean distance reveals a pronounced batch effect in both sample pairs and zebrafish lines. (C) Principal component analysis focusing on the top 25% of the most variable genes, confirming a partial clustering effect attributed to the specific zebrafish lines. (D) UpSet plot providing a visual representation of unique and shared genes that showed significant differential expression (adjusted P-value <0.05) in the paired differential expression analysis. The blue bars on the left show the total number of genes differentially expressed per mutant/control pair. The black bar plot on top indicates the number of genes that are commonly differentially expressed in the mutants indicated with the black dot below. Detailed information on individual genes and the intercept can be found in Tables S2 and S3.

Acknowledgments
This image is the copyrighted work of the attributed author or publisher, and ZFIN has permission only to display this image to its users. Additional permissions should be obtained from the applicable author or publisher of the image. Full text @ Biol. Open