IMAGE

Fig. 1

ID
ZDB-IMAGE-241115-123
Source
Figures for Shin et al., 2024
Image
Figure Caption

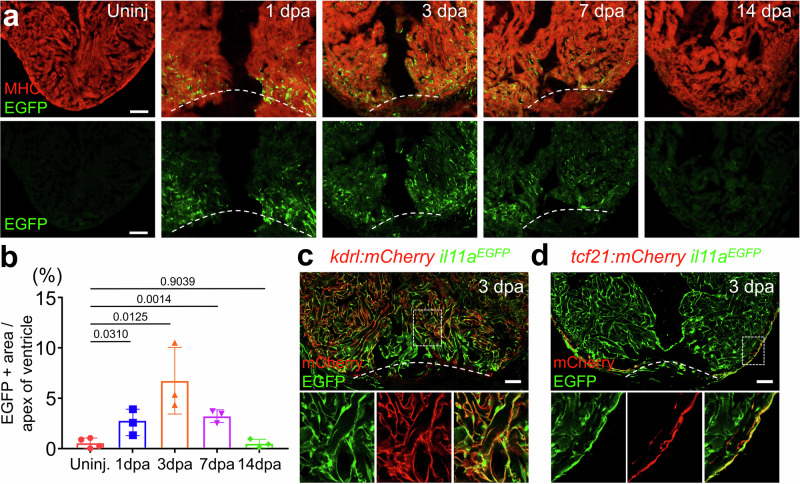
Fig. 1 Spatiotemporal il11a expression during heart regeneration in adult zebrafish.

a Representative cardiac section images of il11aEGFP. Uninj, Uninjured. dpa, days post-amputation. b Quantification of EGFP expression area near the wound area. Biological replicates = 4, 3, 3, and 3 for uninjured and 3, 7, and 14 dpa hearts, respectively. Comparison of il11aEGFP expressing cells with kdrl:mCherry (c) and tcf21:mCherry (d) in 3 dpa hearts. kdrl:mCherry and tcf21:mCherry represent endocardium and epicardium, respectively. Dash boxes correspond to the region magnified in the panels below. Dotted lines demarcate the amputation plane. Scale bars, 100 µm in (a), 50 µm in (c) and (d). Data are mean ± SEM in (b). p-values were determined by one-way ANOVA with Dunnett’s multiple comparison test in (b).

Acknowledgments
This image is the copyrighted work of the attributed author or publisher, and ZFIN has permission only to display this image to its users. Additional permissions should be obtained from the applicable author or publisher of the image. Full text @ Nat. Commun.