
|
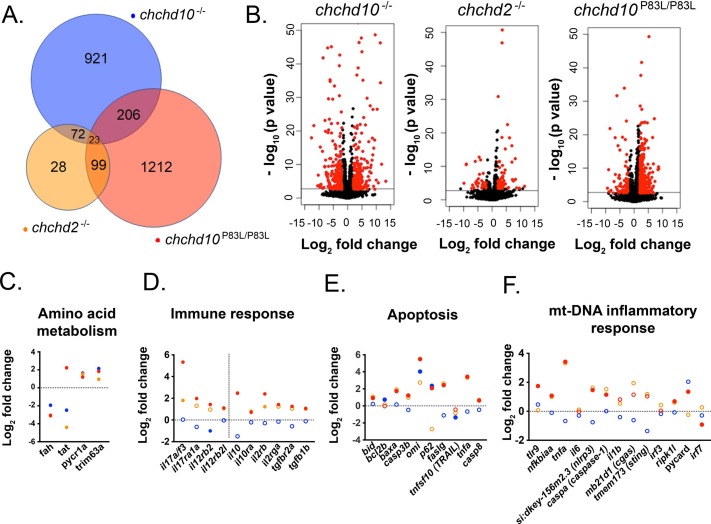
Fig. 8 RNA sequencing results of 7-month-old adult chchd10?/?, chchd2?/?, and chchd10P83L/P83L spinal cords compared to RNA from wild type spinal cords. A, Number of shared and total significantly altered transcripts (p > 0.05) compared to transcripts in spinal cords from wild type zebrafish. B, Volcano plots showing differentially expressed transcripts with their Log2 fold change. Significantly altered transcripts (p > 0.05) are represented in red and transcripts not found to be significantly altered are labelled in black. Transcripts involved different cellular pathways found to be significantly altered including amino acid metabolism (C), immune response (D), apoptosis (E), and mt-DNA inflammatory response (F). Data presented in C?F are Log2 fold change compared to transcripts derived from wild type spinal cords. Blue dots represent chchd10?/? transcripts, orange dots represent chchd2?/? transcripts, and red dots represent chchd10P83L/P83L transcripts. Filled dots represent significant changes (p < 0.05), and empty dots represent transcript expression levels that are not significantly different when compared to transcripts derived from wild type spinal cords (p > 0.05). (For interpretation of the references to colour in this figure legend, the reader is referred to the web version of this article.)