
|
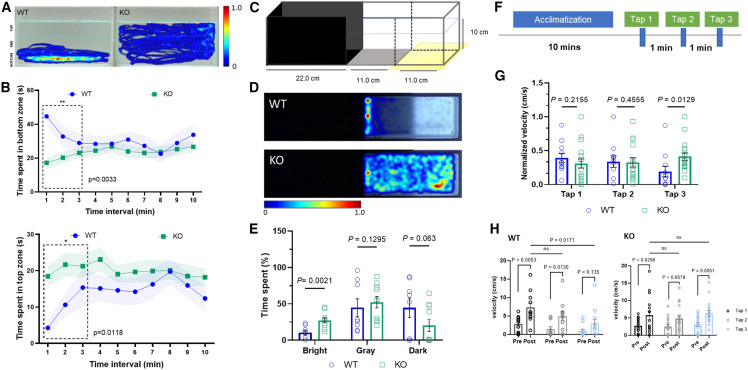
Fig. 6 Behavioral characterization of zfx knockout zebrafish (A) Representative heatmap image for novel tank assay during the first 3 min. The lines indicate the boundaries of three vertically different zones (top, middle, and bottom). (B) Quantification of average time spent in novel tank assay. Upper graph shows WT spent significantly increased time in bottom zone (t = 2.983, df = 23, p = 0.0033, n = 8); lower graph shows KO fish spent higher time in the top zone (t = 2.424, df = 23, p = 0.0118, n = 17). (C) Test apparatus for the scototaxis assay modified with gray and bright zone. The external light source is placed underneath the tank to evaluate the specific preference of adult zebrafish. (D) Representative heatmap image for scototaxis assay. (E) Quantification of percentage of average time spent in bright, gray, and dark zones. KO zebrafish spent significantly increased time in the bright zone (t = 3.516, df = 16, p = 0.0021, n = 10) compared to WT siblings (n = 8). (F) Behavioral paradigm showing the 10-min acclimatization in the round container followed by three tap stimuli with 1-min intervals. (G) Quantification of normalized velocity (cm/s) post-tap. WT (n = 11) and KO (n = 17) indicated similar response for both the first and second tap stimuli. For the third tap, KO zebrafish displayed significantly increased response (t = 2.378, df = 26, p = 0.0129). (H) Quantification of velocity change (pre- and post-tap). WT fish showed a trend of decreasing response to the tap stimuli, whereas KO fish showed significantly increased response to the third tap (t = 2.907, df = 16, p = 0.0051).