
Image
|
Figure Caption
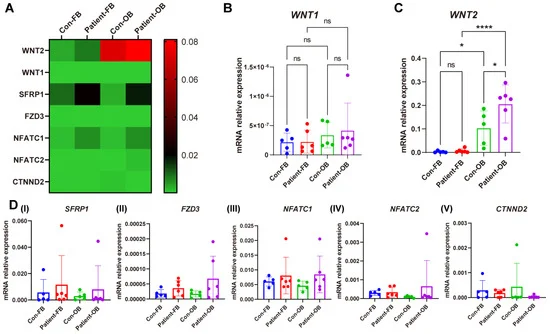
Fig. 7 Relative gene expression of WNT pathway components in fibroblasts and osteoblast-like cells of PLS3-variant patients. Fibroblasts and osteoblast-like cells from six PLS3-variant patients and five controls. (A) The heat map shows the relative gene expression measured by qPCR. GAPDH was used to normalize gene expression. Relative gene expression of (B) WNT1, (C) WNT2, and (D) SFRP1, FZD3, NFATC1, NFATC2, and CTNND2 (* p < 0.05, **** p < 0.0001).
Acknowledgments
This image is the copyrighted work of the attributed author or publisher, and
ZFIN has permission only to display this image to its users.
Additional permissions should be obtained from the applicable author or publisher of the image.
Full text @ Cells