
Image
|
Figure Caption
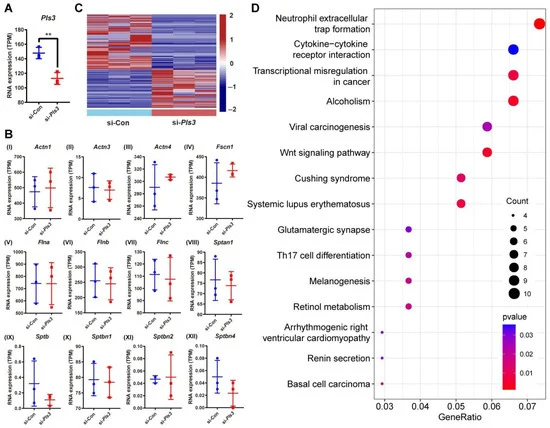
Fig. 5 Differential gene expression in MLO-Y4 cells following Pls3 knockdown. (A) Expression of Pls3 analyzed by RNA sequencing. Significant effect of the treatment: ** p < 0.01. (B) The expression of actin-binding proteins was analyzed by RNA sequencing. (C) Heat map shows the expression pattern of mRNAs between the si-Con and si-Pls3 groups: differentially upregulated mRNAs (total 259), and differentially downregulated mRNAs (total 368). (D) KEGG pathway enrichment analysis based on mRNA expression differences between the si-Con and si-Pls3 groups.
Acknowledgments
This image is the copyrighted work of the attributed author or publisher, and
ZFIN has permission only to display this image to its users.
Additional permissions should be obtained from the applicable author or publisher of the image.
Full text @ Cells