
Image
|
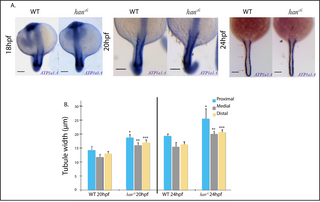
Figure Caption
Fig. 5 Comparison of ATP1a1a.4 pronephric tubule expression patterns during late somitogenesis of WT and hans6 embryos. A. ATP1a1a.4expression within the pronephric tubule at 24 and 20 hpf, illustrating the lateral expansion in hans6 mutants. At 18 hpf, this difference is barely noticeable. Scale bars: 100 ?m. B. Pronephric tubule width measurements of WT and hans6 mutants taken at three defined levels along the A-P axis. Significant differences were found between pairs of levels compared in all plotted stages (n = 7; p-value? 0.005; Dunn?s post-hoc test).
Figure Data
Acknowledgments
This image is the copyrighted work of the attributed author or publisher, and
ZFIN has permission only to display this image to its users.
Additional permissions should be obtained from the applicable author or publisher of the image.
Full text @ PLoS One