
Image
|
Figure Caption
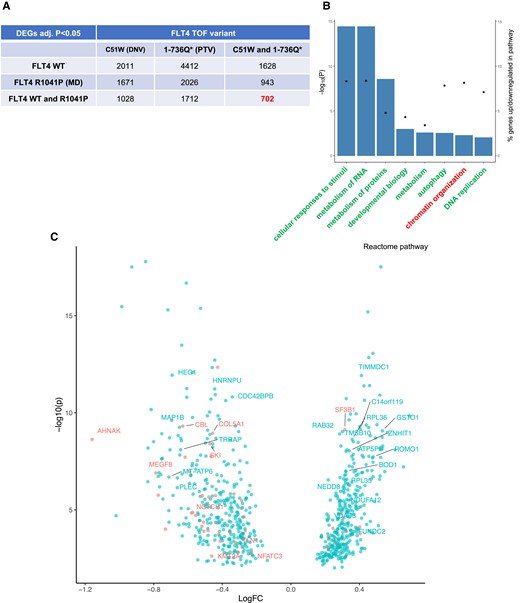
Fig. 4 Distinct transcriptomic profiles of primary human ECs expressing both types of TOF variants compared with WT or an MD FLT4. (A) Distribution of DEGs between HUVECs expressing FLT4-V5 WT, FLT4 R1041P (MD), and FLT4 TOF-DNV (C51W) or FLT4-TOF-PTV (1-736Q*), identified by RNAseq. (B) Reactome analysis of the 702 TOF FLT4-specific DEGs, up- or down-regulated examined separately, displaying pathways identified with FDR < 0.01. (C) Volcano plot showing the 702 FLT4 TOF-specific DEGs, with genes taken forward for qPCR analysis labelled, and those previously associated with CHD in red.
Acknowledgments
This image is the copyrighted work of the attributed author or publisher, and
ZFIN has permission only to display this image to its users.
Additional permissions should be obtained from the applicable author or publisher of the image.
Full text @ Cardiovasc. Res.