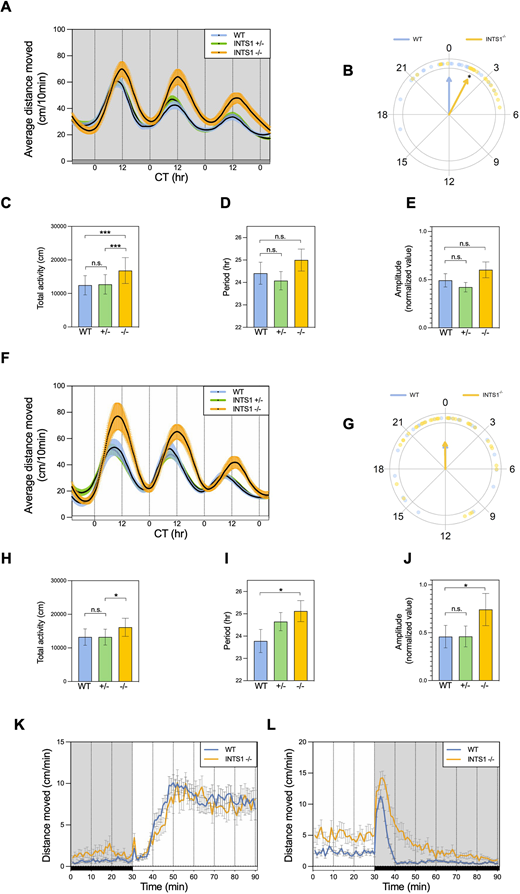
Fig. 4 Abnormal circadian rhythms of locomotor activity and dark-response in Ints1-deficient zebrafish larvae. (A) Circadian locomotor activity of 6?8 dpf ints1 homozygous (?/?) mutant larvae, and their heterozygous (?/+) and wild-type (+/+) siblings under constant dim light (DimDim, 7.5 lux). Progenies of heterozygous intercrosses were entrained under light/dark (LD) cycles for 3 days, followed by 2 days of light/dim light (LDim) cycles, and then exposed to DimDim for an additional 3 days, during which their activity was monitored. The x-axis represents the circadian time (CT, in hours); the y-axis represents the average distance travelled (cm/10 min). Colored areas represent the ąs.e. (n=31 homozygotes; 63 heterozygotes; 33 WT siblings). The gray horizontal bar at the bottom represents the illumination during monitoring, DimDim. (B) Circular plot depicting the phase of circadian locomotor activity rhythm of ints1-deficient (INTS1?/?) mutants (yellow) with respect to that of WT siblings (blue) under DimDim; each dot represents the value for one individual larvae. Arrow direction indicates the mean phase of each genotype, arrow length is inversely related to variation within the group. A 2-h phase-delay was observed for ints1 mutants (*P<0.05, Watson-Williams test). (C?E) Under DimDim, Ints1-deficient larvae exhibit higher total locomotor activity (measured as distance moved in cm; ***P<0.001, mixed model ANOVA using Type II Wald Chi-squared tests) (C) with minor and insignificant variations in duration period (in hours) and amplitude (D and E, respectively) compared with WT larvae. n.s., non-significant; error bars represent ąs.e. (F) Circadian locomotor activity of 6?8 dpf ints1 mutant larvae and their siblings under constant light (LL, 980 lux). Progenies of heterozygous intercrosses were entrained under LD cycles for 3 days, followed by 2 days of LDim cycles, and then exposed to LL for an additional 3 days, during which their activity was monitored. The x-axis represents the circadian time (CT, hours); the y-axis represents the average distance travelled (cm/10 min). Colored areas represent the ąs.e. (n=37 homozygotes; 67 heterozygotes; 35 WT siblings). The white horizontal bar at the bottom represents the illumination during monitoring, LL. (G?J) Under LL, Ints1-deficient larvae exhibit no differences in circadian phase compared to their WT siblings (G), but show significantly higher total activity (cm), longer period length (hours), and higher amplitude (*P<0.05 for all effects, mixed model ANOVA using Type II Wald Chi-squared tests). ?n.s.? denotes non-significant; error bars in H-J represent ąs.e. (K,L) Motor activity response of ints1-deficient larvae and their WT siblings to photic transitions, i.e. light-to-dark (K) and dark-to-light (L). LD-entrained larvae (5 dpf) were exposed to alternating light?dark conditions, and their activity was measured before and after the photic transition. The x-axis represents the time (min); the y-axis represents the average distance travelled (cm/min). Horizontal white and black bars (bottom) represent illumination during monitoring, i.e. light and dark, respectively. Error bars represent ąs.e. (n=33 homozygotes; 38 WT siblings). While no differences between genotypes were observed in response to the transition from dark to light (K), homozygous mutant larvae exhibited an irregular response to the transition from light to dark compared with their WT siblings, characterized by extended activity in response to darkness (L).
Image
Figure Caption
Figure Data
Acknowledgments
This image is the copyrighted work of the attributed author or publisher, and
ZFIN has permission only to display this image to its users.
Additional permissions should be obtained from the applicable author or publisher of the image.
Full text @ Dis. Model. Mech.

