
|
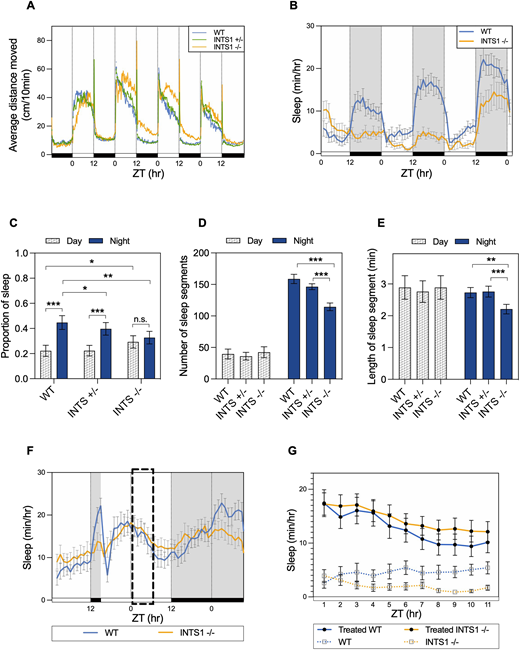
Fig. 3 Ints1 function is essential for maintaining locomotor activity and sleep?wake cycles in zebrafish. (A) Locomotor activity analysis of ints1 mutant larvae and their siblings under light/dark (LD) cycles. The average distance moved (cm/10 min) is plotted on the y-axis; the zeitgeber time (ZT, in hours; 0=lights on; 12=lights off) is plotted on the x-axis. White and black horizontal bars indicate light and dark conditions, respectively. n=83 homozygotes (INTS1 ?/?); 169 heterozygotes (INTS1 +/?); 72 WT siblings. Progenies of heterozygous intercrosses were exposed to LD cycles and their locomotor activity was measured at 5?8 dpf. (B) Average sleep time of Ints1-deficient (INTS1 ?/?) larvae and their WT siblings at 6?8 dpf under LD cycles. The average sleep time [min/h] is plotted on the y-axis; ZT (h) is plotted on the x-axis. White and black horizontal bars indicate light and dark conditions, respectively. Error bars represent �s.e. (n=24 homozygotes; 24 WT siblings). (C) Sleep proportion separately computed under light and dark conditions using data from 6?8 dpf larvae. Both WT (n=72) and heterozygous (n=169) larvae exhibited a substantial difference in sleep proportion between day and night (***P<0.001, mixed model ANOVA using Type II Wald Chi-squared tests), while no significant difference was observed between day and night for homozygotes (n=83; error bars represent �s.e.). Homozygous mutants exhibited significantly reduced nighttime sleep compared with WT and heterozygotes (**P<0.01 and *P<0.05, respectively, mixed model ANOVA using Type II Wald Chi-squared tests), and increased daytime sleep compared with WT (*P<0.05, mixed model ANOVA using Type II Wald Chi-squared tests). n.s., non-significant. (D) Number of sleep segments per night is reduced in Ints1-deficient larvae (n=83; ***P<0.001, mixed model ANOVA followed by post-hoc analysis) compared with WT (n=72) and heterozygous (n=169) larvae. Error bars represent �s.e. (E) Reduced length of sleep segment during the night was observed for ints1-deficient larvae (n=83) compared with WT (n=72) and heterozygous (n=169) larvae (**P<0.01 and ***P<0.001, mixed model ANOVA followed by post-hoc analysis). Error bars represent �s.e. (F) LD-trained larvae were exposed to 9 h of sleep deprivation, starting from 3 h after lights out. The average sleep time (min/h) is plotted on the y-axis; ZT (h) is plotted on the x-axis. White and black horizontal bars indicate light and dark conditions, respectively. Error bars represent �s.e. (n=33 homozygotes; 38 WT siblings). Normal sleep rebound (indicated by dashed box) was measured in homozygotes with respect to their WT siblings. (G) Sleep rebound was measured in sleep-deprived WT and Ints1-deficient larvae compared with non-deprived larvae during the day after sleep-deprivation treatment. The average sleep time (min/h) is plotted on the y-axis; ZT (h) is plotted on the x-axis. Error bars represent �s.e. (n=34 homozygotes; 32 WT siblings). Both genotypes exhibited a typical consolidated sleep pattern after the sleep-deprivation treatment.