
|
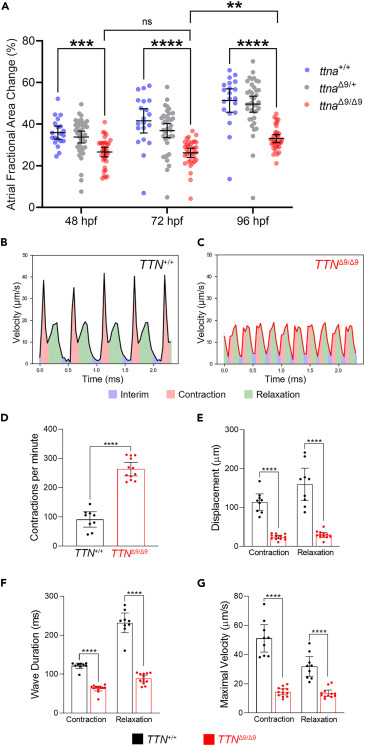
Fig. 4 ttna?9/?9 zebrafish atria and TTN?9/?9-hiPSC-aCMs exhibit reduced atrial contractility (A) Quantification of atrial contraction for ttna+/+ (n = 20), ttna?9/+ (n = 39), and ttna?9/?9 (n = 33) embryos at 48, 72, and 96 hpf. (B and C) Representative recordings of the contraction of TTN+/+-hiPSC-aCMs and TTN?9/?9-hiPSC-aCMs. (D?G) Quantification of contraction frequency (D), displacement (E), wave component duration (F), and maximal velocity (G) during contraction and relaxation of hiPSC-aCMs (n = 3 independent batches, n = 3 biological replicates per batch). Data in (A, D?G) are represented as mean �95% confidence intervals. ns p > 0.05; ??p < 0.01; ???p < 0.001; ????p < 0.0001. See also Figure S7 and Table S1 .