
|
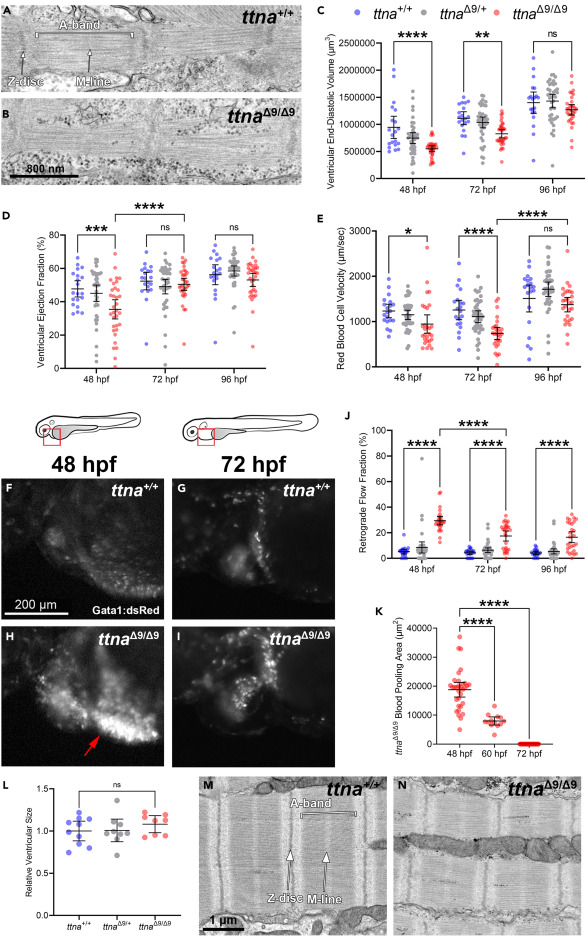
Fig. 2 ttna?9/?9 zebrafish exhibit a transient reduction in ventricular function during development (A and B) Representative transmission electron microscopy (TEM) images of sarcomeres in wild-type (ttna+/+, n = 2) and ttna?9/?9 (n = 5) zebrafish embryonic cardiomyocytes at 48 hpf. (C?E) Quantification of ventricular end-diastolic volume (C), ejection fraction (D), and red blood cell velocity (E) for ttna+/+, ttna?9/+, and ttna?9/?9 embryos at 48, 72, and 96 hpf. (F?I) Representative images of wild-type and ttna?9/?9 embryos? blood flow in the inflow tract, visualized with the red blood cell-labeling transgenic line gata1:dsRed at 48 and 72 hpf. Red boxes indicate the location of the inflow tract, and red arrow indicates blood pooling. (J) Quantification of the blood retrograde flow fraction between the atrium and inflow tract for ttna+/+, ttna?9/+, and ttna?9/?9 embryos at 48, 72, and 96 hpf. (K) Quantification of blood-pooling area in the inflow tract of ttna?9/?9 embryos at 48, 60, and 72 hpf. (L) 12?15-months-old ttna+/+ (n = 10), ttna?9/+ (n = 9), and ttna?9/?9 (n = 8) ventricular relative size. (M and N) Representative TEM images of sarcomeres in ttna+/+ (n = 3) and ttna?9/?9 (n = 3) ventricular cardiomyocytes at 6 months of age. n value for (C?K): ttna+/+ n = 20, ttna?9/+ n = 39, ttna?9/?9 n = 33. Data in (C?E, J?L) are represented as mean �95% confidence intervals. ns p > 0.05; ?p < 0.05; ??p < 0.01; ???p < 0.001; ????p < 0.0001. See also Figures S2 and S4 .