
|
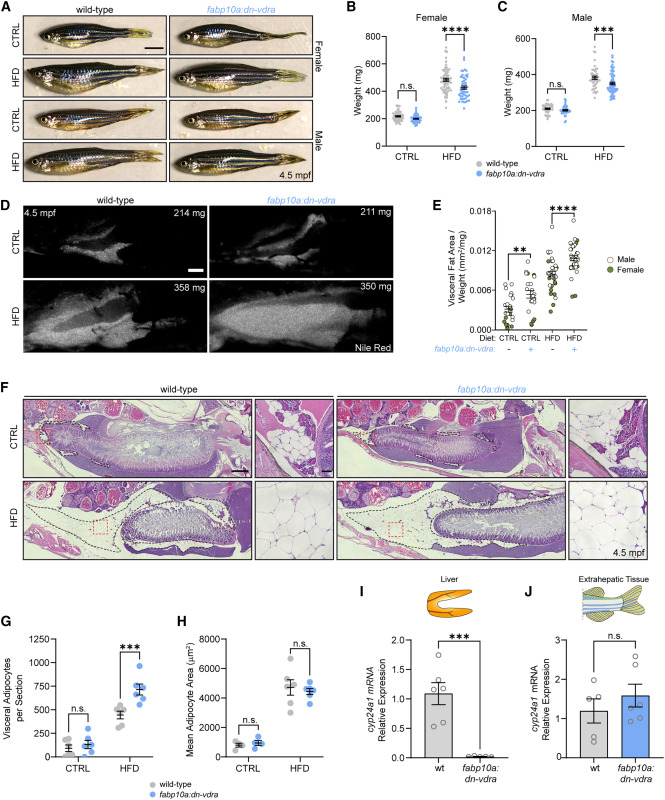
Fig. 6 Hepatocyte Vdr impairment reduces organismal growth induced by nutrient repletion and causes visceral fat expansion (A) 4.5-mpf fish following 8 weeks of CTRL or HFD. Scale bar, 0.5 cm. (B) Female weight at 4.5 mpf. Two-way ANOVA with Sidak?s multiple comparison test. n = 58 WT.CTRL, 51 dn-vdra.CTRL, 71 WT.HFD, 50 dn-vdra.HFD. (C) Male weight at 4.5 mpf. Two-way ANOVA with Sidak?s multiple comparison test. n = 36 WT.CTRL, 42 dn-vdra.CTRL, 45 WT.HFD, 66 dn-vdra.HFD. (D) Nile red analysis of visceral fat at 4.5 mpf following CTRL or HFD treatment. Fish weight is specified in each image. Scale bar, 1 mm. (E) Visceral fat area normalized to fish weight. Two-way ANOVA with Sidak?s multiple comparison test. n = 24 WT.CTRL, 23 dn-vdra.CTRL, 34 WT.HFD, 34 dn-vdra.HFD. (F) H&E staining of sagittal sections of females at 4.5 mpf following CTRL or HFD treatment. Visceral adipose tissue is outlined with dashed black lines. Red dashed boxes delineate the magnified region. Scale bars, 500 ?m and 50 ?m (magnified images). (G) Visceral adipocytes per sagittal section. Two-way ANOVA with Sidak?s multiple comparison test. n = 6 per group. (H) Mean adipocyte area. Two-way ANOVA with Sidak?s multiple comparison test. n = 4 per group for CTRL, 6 per group for HFD. (I and J) RT-qPCR analysis of hepatic (I) and extrahepatic (J) cyp24a1 expression. Unpaired two-tailed t test. Each sample is a single liver or extrahepatic tissue specimen. n = 6 WT, 5 dn-vdra. Error bars are mean + SEM. ??p < 0.01, ???p < 0.001, ????p < 0.0001. See also Figure S6 .