
|
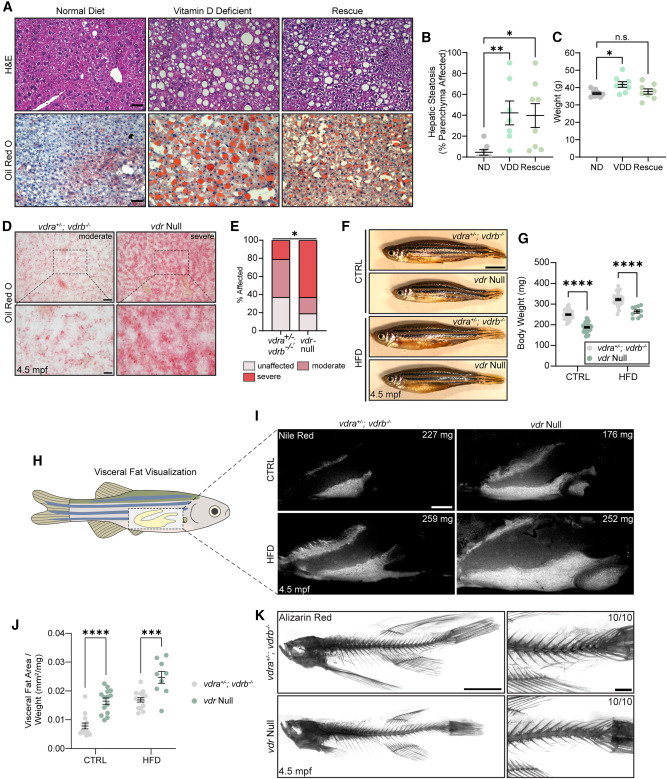
Fig. 1 Global depletion of Vdr signaling elicits hepatic steatosis and increases visceral adiposity (A) H&E and oil red O analysis of hepatic steatosis in 11-month-old male mice a fed normal (ND), vitamin D-deficient (VDD), or rescue diet. Scale bars, 50 ?m. (B) Quantification of steatosis in H&E-stained liver. Kruskal-Wallis test with Dunn?s multiple comparison test. n = 8 ND, 7 VDD, 8 rescue. (C) Mouse weight. One-way ANOVA with Dunnett?s multiple comparison test. n = 8 per group. (D) Oil red O analysis of hepatic steatosis in male zebrafish liver at 4.5 mpf. Scale bars, 50 ?m (top) and 15 ?m (bottom). (E) Analysis of oil red O staining severity. Chi-square test. n = 19 vdra+/?; vdrb?/?, 16 vdr null. (F) Images of 4.5-mpf male fish following CTRL or HFD feeding. (G) Fish weight. Two-way ANOVA with Sidak?s multiple comparison test. n = 34 Het.CTRL, 31 Null.CTRL, 28 Het.HFD, 10 Null.HFD. (H) Schematic of visceral fat (yellow, inside the dashed box) anatomy in adult zebrafish. (I) Nile red analysis of visceral fat at 4.5 mpf. Fish weight is noted in each image. Scale bar, 1 mm. (J) Visceral fat area normalized to fish weight. Two-way ANOVA with Sidak?s multiple comparison test. n = 14 Het.CTRL, 14 Null.CTRL, 15 Het.HFD, 9 Null.HFD. (K) Alizarin red analysis of skeletal integrity of CTRL diet-fed fish. The number of individuals resembling the representative image is noted in each image. Scale bar, 1 mm Error bars are mean + SEM. ?p < 0.05, ??p < 0.01, ???p < 0.001, ????p < 0.0001; n.s., not significant. See also Figure S1 .