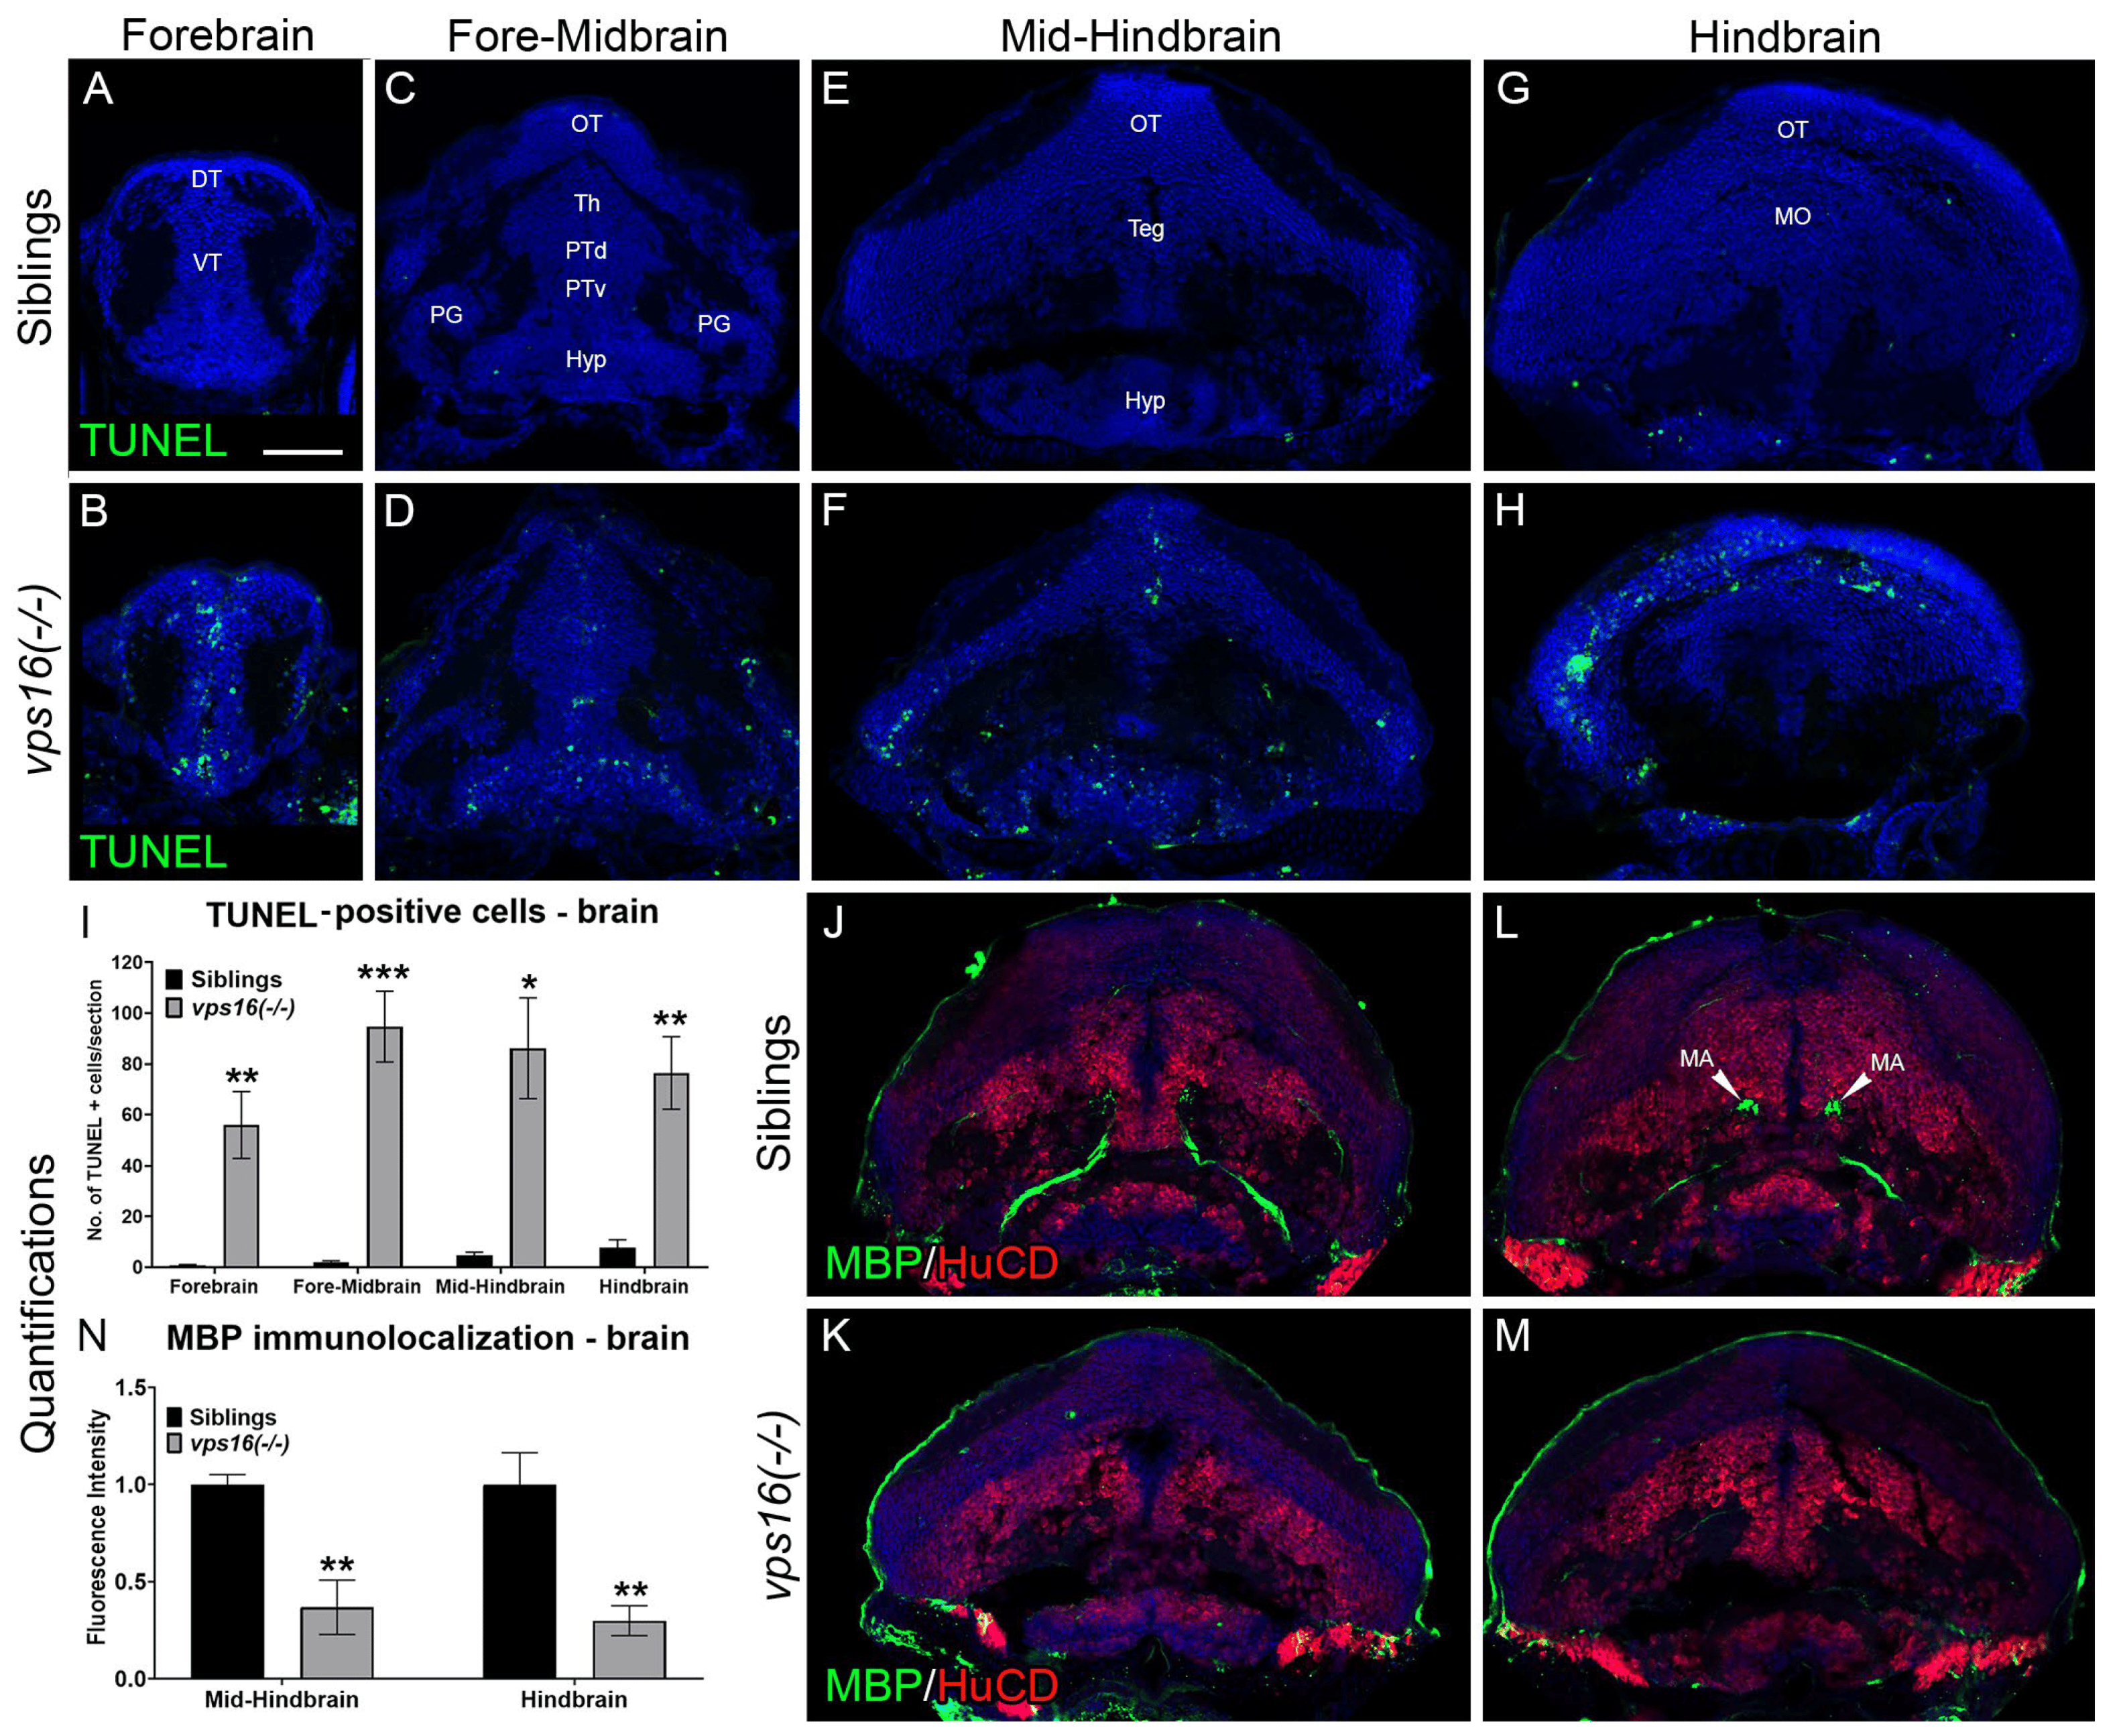
Fig. 3 vps16(-/-) mutants show significant cell death and hypomyelination by 7 dpf. (A?I) TUNEL assay performed on brain sections of 7 dpf sibling and vps16(-/-) mutant larvae. Brain sections identified and sub-categorized in four regions: (A,B) forebrain, (C,D) fore-midbrain, (E,F) mid-hindbrain, and (G,H) hindbrain. (A,C,E,G) Minimal to no TUNEL-positive apoptotic cells (green) seen in sibling brain regions (n: 10 forebrain, 7 fore-midbrain, 9 mid-hindbrain, 4 hindbrain). (B,D,F,H) Numerous TUNEL-positive apoptotic cells (green) seen in vps16(-/-) mutant brain regions (n = 10 forebrain, p = 0.0022; n = 7 fore-midbrain, p = 0.0005; n = 5 mid-hindbrain, p = 0.0146; n = 7 hindbrain, p = 0.0027). (I) Graph representing quantification of average number of TUNEL-positive apoptotic cells in specific brain regions of 7 dpf siblings and vps16(-/-) mutants. (J?N) Immunolocalization of MBP (myelin, green) and HuCD (neurons, red) in brain section from two regions of sibling and vps16(-/-) mutant larvae: (J,K) mid-hindbrain and (L,M) hindbrain. (J?L) MBP immunolocalizes to Mauthner axons in mid-hindbrain (n = 6) and hindbrain (n = 6) regions of sibling brain. (K,M) MBP immunolocalization in mid-hindbrain (n = 6, p = 0.0048) and hindbrain (n = 6, p = 0.0061) regions of vps16(-/-) mutant brain showing decrease in myelin content. (N) Graph representing quantification of MBP immunolocalization in specific brain regions of 7 dpf siblings and vps16(-/-) mutants. Scale bar in panel A = 50 microns for all images. Blue = TO-PRO-3, nuclear stain. Error bars indicate SEM. * p < 0.05, ** p < 0.01, *** p < 0.001.
Image
Figure Caption
Figure Data
Acknowledgments
This image is the copyrighted work of the attributed author or publisher, and
ZFIN has permission only to display this image to its users.
Additional permissions should be obtained from the applicable author or publisher of the image.
Full text @ Int. J. Mol. Sci.

