
|
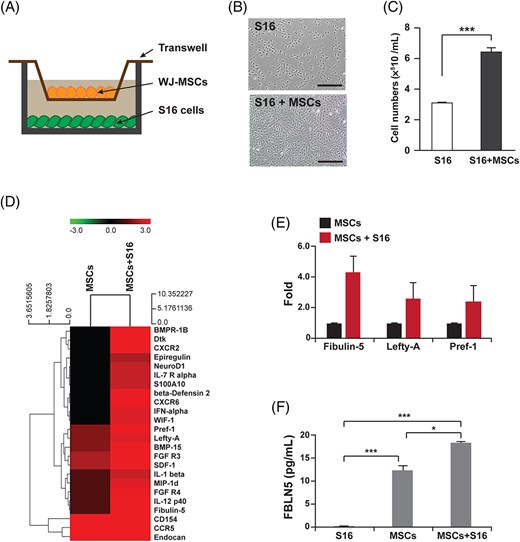
Fig. 1 Identification of WJ-MSCs derived paracrine factors affecting Schwann cell proliferation. A, A schematic diagram for the co-cultivation system of MSCs and S16 cells. B, Images of S16 cells after 24 hours of cultivation with or without WJ-MSCs. Scale bars, 400 ?m. C, Quantification of total number of S16 cells counted at each indicated condition. Statistical significance was determined using the unpaired Student's t-test with Welch's correction (***P < .001). D, A heatmap comparing the expression of secreted proteins in the media collected from the indicated culture conditions. E, Quantifications of fold changes in spot intensities for Fibulin 5, Lefty-A, and Pref-1. F, The concentration of FBLN5 contained in the culture media collected from each indicated condition was measured using ELISA. Statistical significance was determined using one-way ANOVA followed by Tukey's post hoc test (*P < .005, ***P < .001)