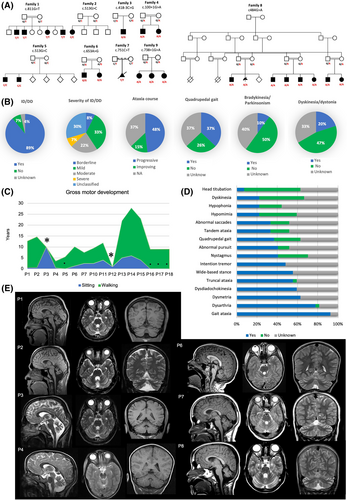
Fig. 1 (A) Presents the pedigrees of the families involved in the study and the segregation of CA8 variants. (B) Provides a visual representation of the distribution of individuals categorized by intellectual disability/developmental disorders (ID/DD), severity of ID/DD, ataxia course, quadrupedal gait, bradykinesia/parkinsonism and dyskinesia/dystonia. (C) Presents a schematic representation of sitting and walking in the new patients of this study. The symbol ?*? denotes individuals for whom the age at walking is not available, whereas the symbol ?.? represents individuals for whom the age at sitting is not available. (D) Displays the prevalence of clinical manifestations among all individuals (n = 27) diagnosed with CA8-related disorders, including both the cohort analyzed in the current study and previously reported cases. (E) Presents the cerebral magnetic resonance imaging of the patients (P1?P4 and P6?P8) in sagittal, axial, and coronal views, which show cerebellar atrophy including the vermis and cerebellar hemispheres. [Color figure can be viewed at wileyonlinelibrary.com]
Image
Figure Caption
Acknowledgments
This image is the copyrighted work of the attributed author or publisher, and
ZFIN has permission only to display this image to its users.
Additional permissions should be obtained from the applicable author or publisher of the image.
Full text @ Mov. Disord.

