
|
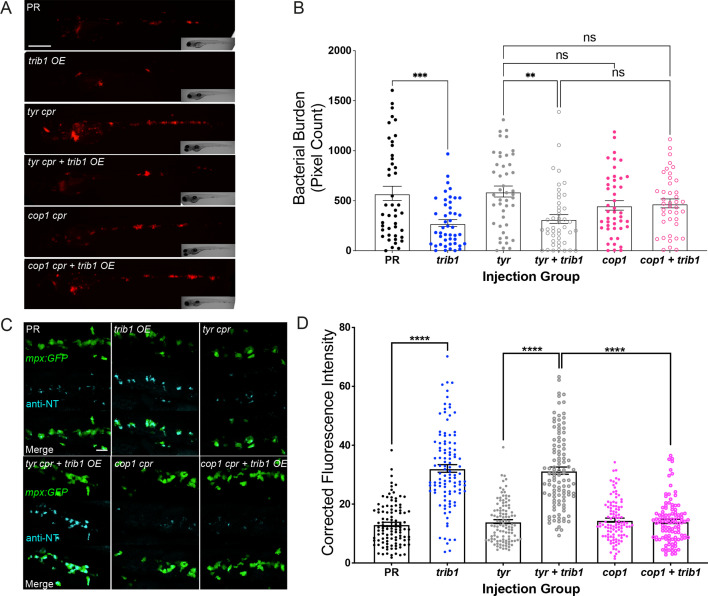
Figure 8 The host-protective effect of trib1 overexpression requires cop1. (A) Stereo-fluorescence micrographs of Mm mCherry infected 4 dpi larvae after injection with trib1 RNA (overexpression, OE) and cop1 guide RNA (CRISPants, cpr) using phenol red (PR, vehicle) and tyrosinase (tyr cpr, unrelated guide RNA) CRISPants as negative controls. Scale bar = 200 µM. (B) Bacterial burden of larvae shown in (A). Data shown are mean ± standard error of the mean (SEM), n = 71–76 accumulated from three independent experiments. Statistical significance determined via one-way analysis of variance (ANOVA) with Bonferroni’s multiple comparisons. p values shown are: **p < 0.01 and ***p < 0.001. (C) Fluorescence confocal z-stacks of the caudal vein region of 2 dpf mpx:GFP larvae (neutrophils) immune labelled with anti-nitrotyrosine (cyan) in the absence of Mm infection. Larvae were injected at the one-cell stage with trib1 RNA (overexpression, OE) and cop1 guide RNA (CRISPants, cpr) using PR (vehicle) and tyrosinase (unrelated guide RNA) CRISPants as negative controls. Scale bar = 30 μm. (D) Corrected fluorescence intensity levels of anti-nitrotyrosine antibody confocal z-stacks shown in (C). Data shown are mean ± SEM, n = 108 cells from 18 embryos accumulated from three independent experiments. Statistical significance was determined using one-way ANOVA with Bonferroni’s multiple comparisons post hoc test. p values shown are: ****p < 0.0001