
Figure 4—figure supplement 3—source data 3.
- ID
- ZDB-IMAGE-240620-246
- Source
- Figures for Hammond et al., 2024
|
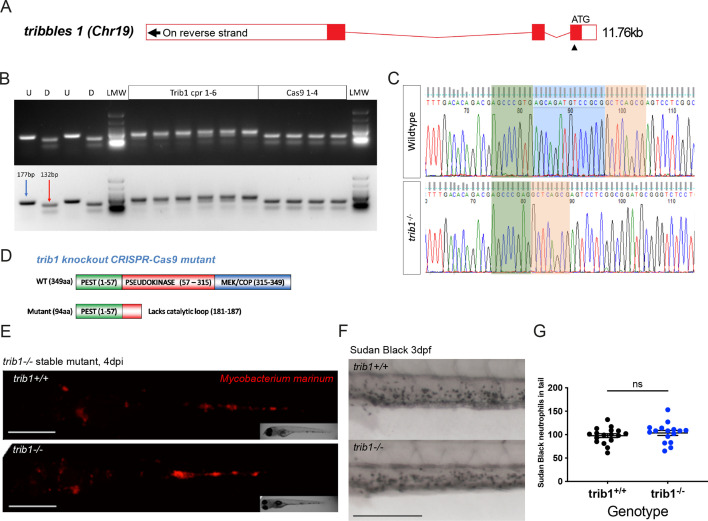
Figure 4—figure supplement 3—source data 3. Generation of a tribbles1 stable mutant line. (A) Schematic of zebrafish trib1 gene exons, with arrowhead showing location of CRISPR guide RNA PAM site in exon 1. (B) Electrophoresis gel of larvae injected with trib1 guide RNA with a SacII restriction digest. The undigested PCR band is 177 bp and the successfully digested band is 132 bp. Two uninjected fish were used as controls without (U) and with (D) digestion. Four cas9 only injected larvae had conserved SacII sites while 6/6 trib1 larvae did not digest with SacII indicating a genomic disruption at the CRISPR PAM site. LMW = NEB Low Molecular Weight ladder for reference. (C) Sequencing trace of a trib1−/− mutant versus a wildtype sibling, demonstrating a 14-bp deletion (loss of AGCAGATGTCCGCG). (D) Schematic showing predicted truncated protein (Δ94aa) caused by trib1−/− mutation compared to the wildtype protein. (E) Stereo-fluorescence micrographs of Mm mCherry infected 4 dpi trib1−/− mutant and wildtype (trib1+/+) sibling larvae. Scale bar = 200 µM. (F) Sudan Black staining of neutrophils in 3 dpf trib1−/− mutant and wildtype (trib1+/+) sibling larvae. Scale bar = 200 µM. (G) Number of Sudan Black-positive neutrophils in the tail of 3 dpf trib1−/− mutant and wildtype (trib1+/+) sibling larvae. Data shown are mean ± standard error of the mean (SEM), n = 16–17 fish accumulated from two independent experiments. Statistical significance (no significance, ns) determined via an unpaired t-test.