
Image
|
Figure Caption
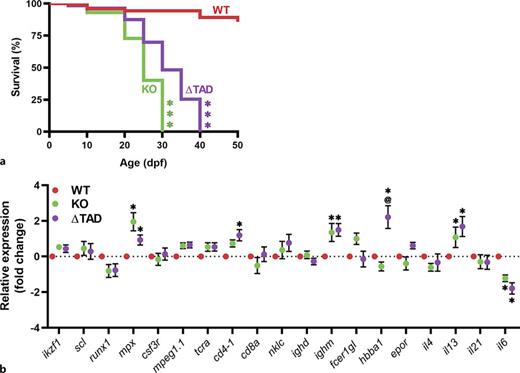
Fig. 7 Effect of Stat3 mutations on juvenile survival and immune cell development. Relative survival of wild-type (WT), knockout (KO), and transactivation domain truncation (?TAD) mutant zebrafish displayed as a Kaplan-Meier curve (n = 15?30) (a). Gene expression analysis of the indicated genes in 28 dpf WT, KO and ?TAD juveniles (n = 6?12) showing mean and SEM (b). Statistical significance is indicated compared to WT (**p < 0.01, *p < 0.05) or between mutants (@@p < 0.01, @p < 0.05).
Acknowledgments
This image is the copyrighted work of the attributed author or publisher, and
ZFIN has permission only to display this image to its users.
Additional permissions should be obtained from the applicable author or publisher of the image.
Full text @ J. Innate Immun.