
|
Figure 4
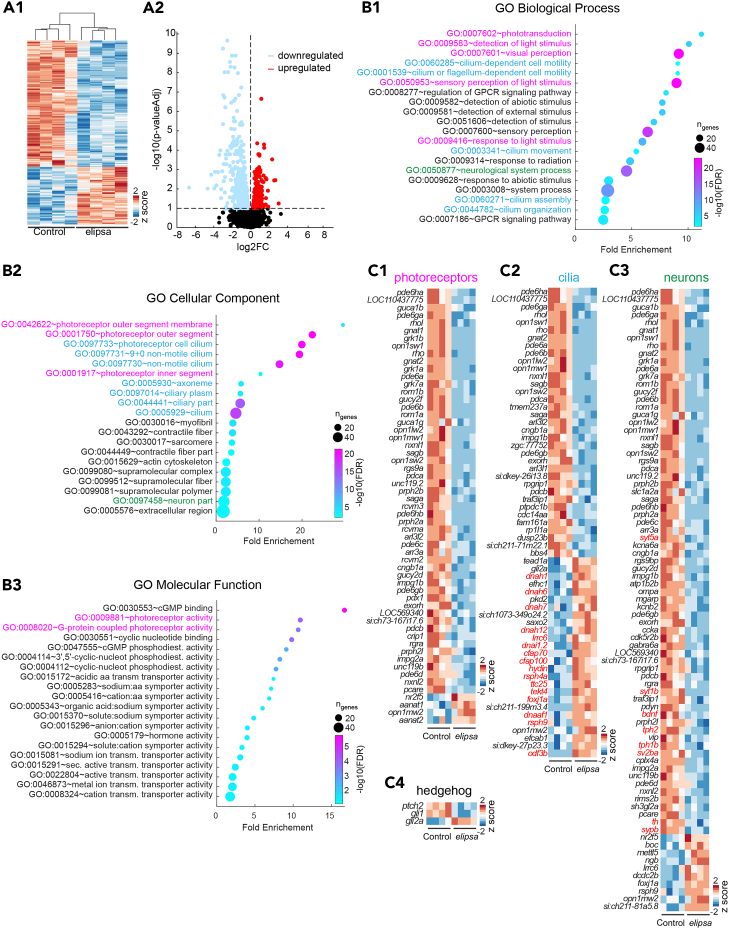
Transcriptomic analysis reveals altered expression of genes involved in phototransduction
(A1) Heatmap of expression of differentially expressed genes (DEGs) from control and
(A2) Volcano plot showing the DEGs in
(B) Top 20 Gene Ontology (GO) biological process (B1) cellular component (B2) and molecular function (B3). Genes associated with GO terms related to phototransduction (magenta), cilia (blue) and neuronal process (green) are represented in (C1–C3).
(C) Heatmaps showing expression of DEGs (represented as
See also