IMAGE

Figure 9

ID
ZDB-IMAGE-240607-125
Source
Figures for Fabian et al., 2024
Image
Figure Caption

Figure 9

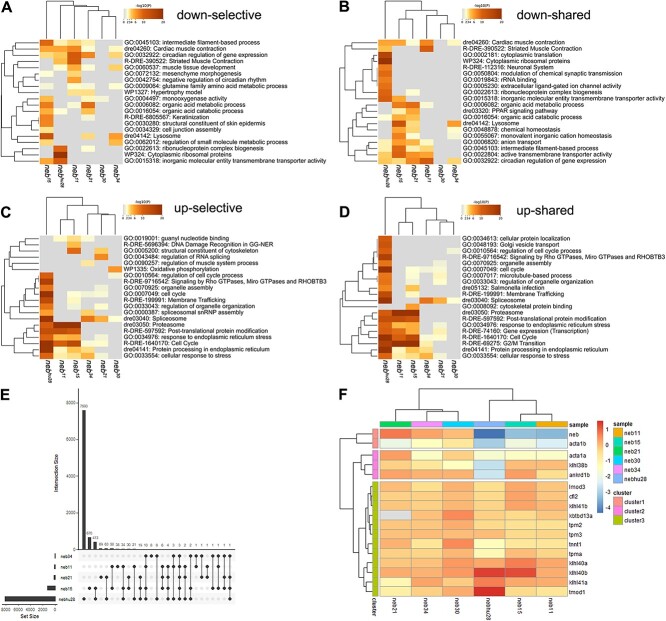
neb mutants show altered transcriptome profile. (A–D) Dendrograms and heatmaps from Metascape enrichment analysis illustrating selective (unique to each comparison in the study) and shared (common to all the comparisons in the study) enriched terms. (A) Selective downregulated pathways. (B) Shared downregulated pathways. Many of the downregulated genes in the nonsense mutants and the splice mutants nebhu28 and neb21 are involved in muscle contraction, muscle tissue development, and intermediate filament-based processes. (C) Selective upregulated pathways. (D) Shared upregulated pathways. Highly upregulated genes in the nonsense mutants are mostly involved in protein degradation processes and response to stress, and cluster under the proteasome and stress response pathways. The heatmap cells are coloured by their p-values; white cells indicate the lack of enrichment for that term in the corresponding gene list. p-value cutoff = 0.05; minimum enrichment = 1.5; minimum overlap = 3; kappa score = 0.3. (E) UpSet plot illustrating number of DEGs unique and shared between the data sets. The nonsense mutants and nebhu28 cluster together. Only three DEGs are shared by all five neb mutants depicted in the plot. (F) Dendrogram and heatmap illustrating expression of nemaline myopathy genes in nebulin mutants. Noticeable, acta1 and tnnt1 are downregulated in several of the mutants investigated in this study. See Supplemental Table 7 for recorded values.

Acknowledgments
This image is the copyrighted work of the attributed author or publisher, and ZFIN has permission only to display this image to its users. Additional permissions should be obtained from the applicable author or publisher of the image. Full text @ Hum. Mol. Genet.