IMAGE

Fig. 2.

ID
ZDB-IMAGE-240606-65
Source
Figures for Zang et al., 2024
Image
Figure Caption

Fig. 2.

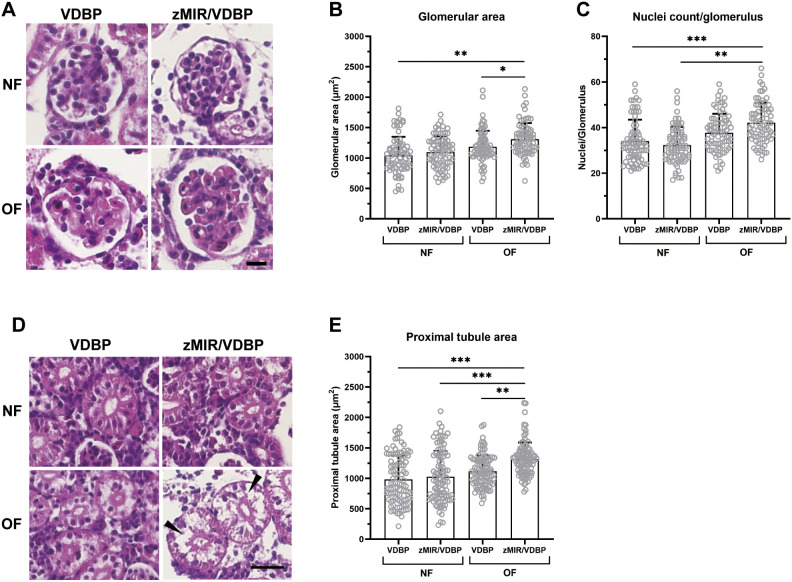
Overfed zMIR/VDBP zebrafish develop glomerular morphological changes. (A) Hematoxylin and Eosin (H&E)-stained paraffin kidney sections revealed marked glomerular hypertrophy in overfed zMIR/VDBP zebrafish. Scale bar: 10 μm. (B,C) Quantification of glomerular area (B) and average nuclear count per glomerular cross-section (C) in the four groups. At least 75 glomeruli from five fish per group were measured on three sections per fish. (D) H&E-stained sections from overfed zMIR/VDBP zebrafish showed pale cytoplasms with proximal tubule enlargement. Black arrowheads indicate the cavities in the proximal tubule, which may be caused by ectopic lipid accumulation. Scale bar: 20 μm. (E) The cross-sectional area of the proximal tubules in overfed zMIR/VDBP fish was significantly larger than that in those fed a control diet or overfed VDBP fish. At least 100 tubular cross-sections were measured in each group. Data are presented as mean±s.e.m. *P<0.05; **P<0.01; ***P<0.001; Bonferroni–Dunn multiple comparisons test.

Figure Data
Acknowledgments
This image is the copyrighted work of the attributed author or publisher, and ZFIN has permission only to display this image to its users. Additional permissions should be obtained from the applicable author or publisher of the image. Full text @ Dis. Model. Mech.