Histopathological analysis of muscle specimens from F1 adult
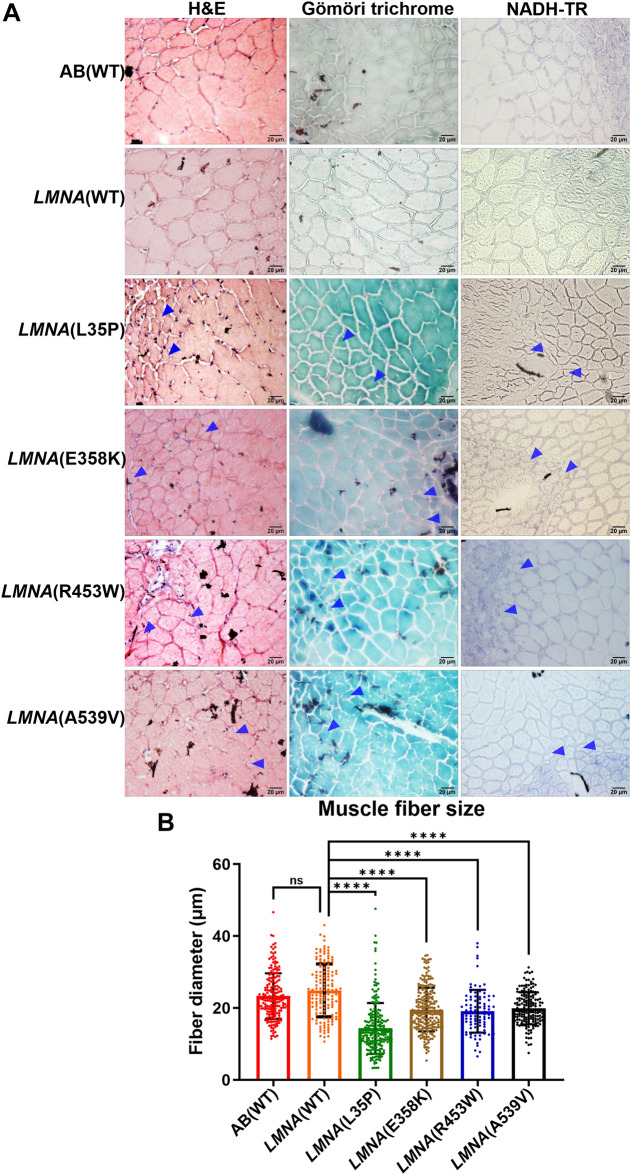
 LMNA transgenic zebrafish. (A) The histopathological characteristics of muscle tissues in F1 adult LMNA transgenic zebrafish were conducted by histological staining using H&E stain, Gömöri trichrome stain, and NADH-TR stain. The blue arrowheads indicated the decreased fiber size. The images were captured at a magnification of × 400, and the scale bar represents 20 μm. (B) The statistical analysis of muscle fiber size from LMNA transgenic zebrafish. The muscle fiber diameter of F1 adult from AB(WT) and LMNA transgenic zebrafish was measured. Each dot represents one muscle fiber. AB(WT): n = 198; LMNA(WT): n = 141; LMNA(L35P): n = 212; LMNA(E358K): n = 226; LMNA(R453W): n = 92; LMNA(A539V): n = 175. The red plot represents AB(WT) fish, the orange plot for LMNA(WT) fish, the green plot for LMNA(L35P) fish, the brown plot for LMNA(E358K) fish, the blue plot for LMNA(R453W) fish, and the black plot for LMNA(A539V) fish. Statistical analysis was comparing the mean of each column with the mean of no drug control using ordinary One-way ANOVA comparing the mean of each column with the mean of control column (LMNA(WT)), and the multiple testing with Dunnett’s test. The presented P-values have been appropriately adjusted, and the level of statistical significance is denoted as follows: *for 0.01 < P ≤ 0.05, **for 0.001 < P ≤ 0.01, ***for 0.0001 < P ≤ 0.001, and ****for P ≤ 0.0001.
This image is the copyrighted work of the attributed author or publisher, and
ZFIN has permission only to display this image to its users.
Additional permissions should be obtained from the applicable author or publisher of the image.
Full text @ Sci. Rep.
Your Input Welcome
Thank you for submitting comments. Your input has been emailed to ZFIN curators who may contact you if
additional information is required.
Oops. Something went wrong. Please try again later.