IMAGE

Figure 3

ID
ZDB-IMAGE-240606-40
Source
Figures for Pan et al., 2024
Image
Figure Caption

Figure 3

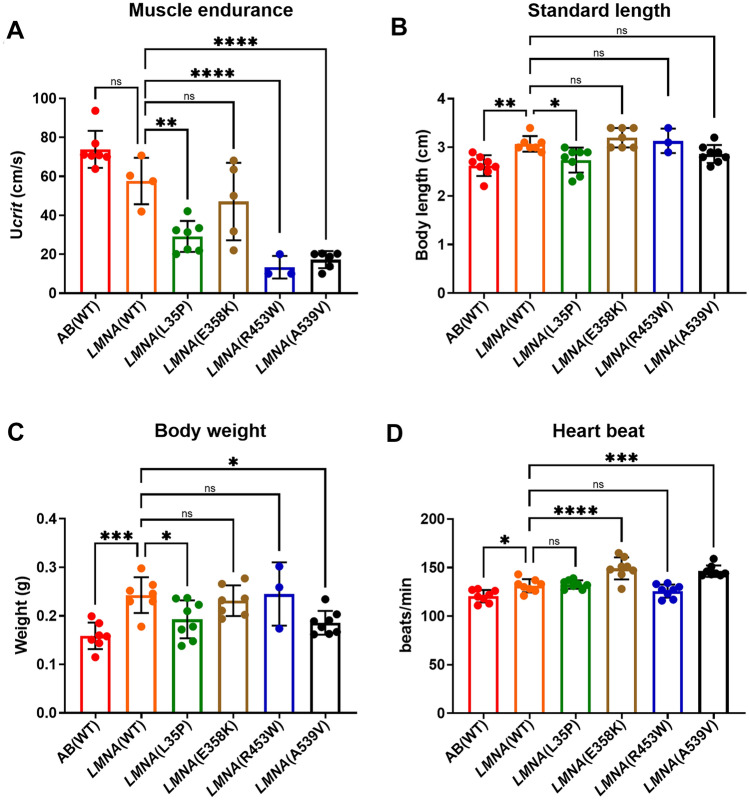
The muscle endurance and heartbeat measurements of F1 adult LMNA transgenic zebrafish. (A) Muscle endurance was assessed using the critical swim speed (Ucrit) measured in a Brett-type swimming tunnel. AB(WT): n = 6; LMNA(WT): n = 4; LMNA(L35P): n = 7; LMNA(E358K): n = 5; LMNA(R453W): n = 3; LMNA(A539V): n = 6. (B) The length of the adult fish were shown. AB(WT): n = 8; LMNA(WT): n = 7; LMNA(L35P): n = 8; LMNA(E358K): n = 7; LMNA(R453W): n = 3; LMNA(A539V): n = 8. (C) body weight of the adult fish were recorded. AB(WT): n = 8; LMNA(WT): n = 7; LMNA(L35P): n = 8; LMNA(E358K): n = 6; LMNA(R453W): n = 3; LMNA(A539V): n = 8. (D) The heartbeat of 4dpf F1 larval fish with different LMNA transgenic variations was measured. AB(WT): n = 8; LMNA(WT): n = 8; LMNA(L35P): n = 8; LMNA(E358K): n = 8; LMNA(R453W): n = 8; LMNA(A539V): n = 8. The red plot represents AB(WT) fish, the orange plot for LMNA(WT) fish, the green plot for LMNA(L35P) fish, the brown plot for LMNA(E358K) fish, the blue plot for LMNA(R453W) fish, and the black plot for LMNA(A539V) fish. Each dot represents one fish. Statistical analysis was conducted using ordinary One-way ANOVA with Dunnett’s test. The presented P-values have been appropriately adjusted, and the level of statistical significance is denoted as follows: *for 0.01 < P ≤ 0.05, **for 0.001 < P ≤ 0.01, ***for 0.0001 < P ≤ 0.001, and ****for P ≤ 0.0001.

Figure Data
Acknowledgments
This image is the copyrighted work of the attributed author or publisher, and ZFIN has permission only to display this image to its users. Additional permissions should be obtained from the applicable author or publisher of the image. Full text @ Sci. Rep.