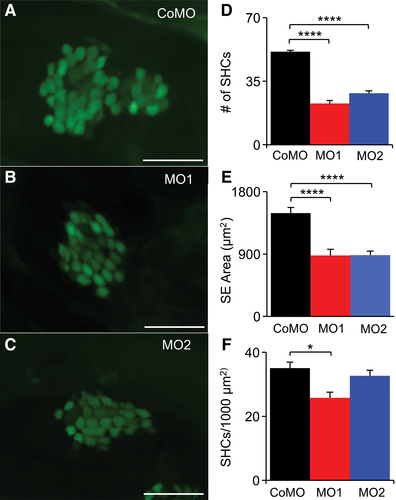
Fig. 5 Reduction in the number of inner ear hair cells in MO1 and MO2 morphants. (A, B, C) Examples of saccular epithelia of CoMO, MO1, and MO2 Et(krt4: GFP) sqet4 fish at 3 dpf. Green areas in SE are GFP-labeled hair cell bodies. Scale bar = 25 ?m. (D) Comparison in the number of saccular hair cells among CoMO, MO1, and MO2 fish, showing that MO1 and MO2 morphants have significantly fewer saccular hair cells than CoMO fish. (E) Comparison in saccular epithelium (SE) area among CoMO, MO1, and MO2 fish, showing that MO1 and MO2 morphants have significantly smaller saccular epithelia than CoMO fish. (F) Comparison of saccular hair cell density among CoMO, MO1, and MO2 fish, showing lower hair cell density in MO1 morphants but not for MO2 morphants. In D?F, values are presented as means + SEM; NCoMO = NMO2 = 8, NMO2 = 9, ANOVA, and post hoc Tukey tests, *P < 0.05, ****P < 0.001.
Image
Figure Caption
Figure Data
Acknowledgments
This image is the copyrighted work of the attributed author or publisher, and
ZFIN has permission only to display this image to its users.
Additional permissions should be obtained from the applicable author or publisher of the image.
Full text @ Anat. Rec. (Hoboken)

