
|
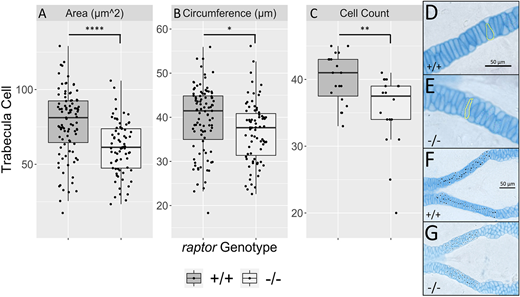
Fig. 5 The trabeculae contain fewer and smaller cells in raptor mutants. (A-C) Measurements of trabecula (A) area, (B) circumference and (C) cell count. Each point is one cell (A,B) or one trabecula (C). (D,E) Representative images of cell size in wild-type (D) and mutant (E) fish. (F,G) Examples of trabeculae cell counts. Each black dot is one cell in wild-type (F) or mutant (G) fish. (D-G) Anterior is towards the left. The statistical comparisons were performed using two-sample t-tests with unequal variances, *P<0.05, **P<0.01, ****P<0.0001. The top and bottom of each box correspond to the third quartile (Q3) and first quartile (Q1), respectively. Each box covers the interquartile range (IQR), where 50% of the data lies. The median is depicted by the horizontal line within each box. The upper whisker extends to the largest value within Q3 + 1.5 * IQR. The lower whisker extends to the smallest value within Q1 - 1.5 * IQR. Any data point outside these whiskers is classified as an outlier. See Mcgill et al. (1978).