
|
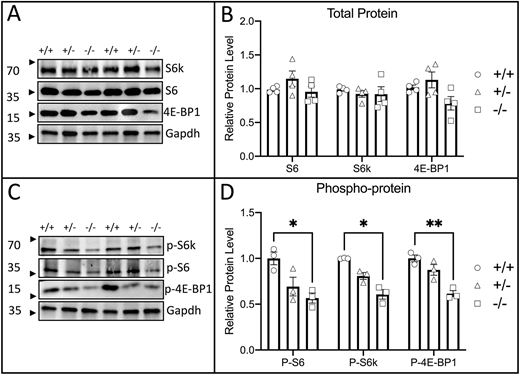
Fig. 3 Zebrafish raptor mutants have reduced mTORC1 activity. (A) Representative immunoblots targeting total protein for mTORC1 targets S6k, S6 and 4E-BP1. Total protein lysates were derived from raptor wild types (+/+), heterozygotes (+/?) and mutants (?/?). This blot displays two biological replicates. (B) Graph of relative total protein levels for mTORC1 target proteins in raptor wild types (circles), heterozygotes (triangles) and mutants (squares). Each point is one biological replicate. Differences are not statistically significant. (C) Representative immunoblots targeting phosphorylated protein for mTORC1 targets S6k, S6 and 4E-BP1. Total protein lysates were derived from raptor wild types (+/+), heterozygotes (+/?) and mutants (?/?). This blot displays two biological replicates. (D) Graph of relative total phosphorylated protein levels for mTORC1 target proteins in raptor wild types (circles), heterozygotes (triangles) and mutants (squares). Each point is one biological replicate. Levels of phosphoprotein for each mTORC1 target were significantly reduced relative to wild type. For all blots, protein was from the heads of 4 dpf fish. The statistical analyses were conducted using one-way ANOVA followed by Tukey's honest significant difference (HSD) post-hoc test for multiple comparisons, *P<0.05, **P<0.01. Data are mean�s.e.m.