
Image
|
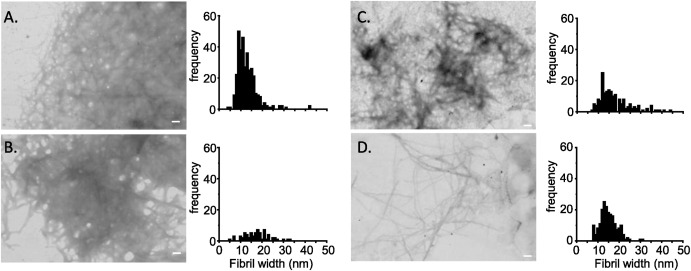
Figure Caption
Fig. 2 Electron microscopic analysis of fibrils formed by A. NKB(WT); B. NKB(F6W); C. NKB(+A6) and D. zf-NKB. On the right of each microscope image is the width distribution of the fibrils estimated from EM images. The mean ± SEM of this data is presented in the main text. Scale bar = 100 nm.
Acknowledgments
This image is the copyrighted work of the attributed author or publisher, and
ZFIN has permission only to display this image to its users.
Additional permissions should be obtained from the applicable author or publisher of the image.
Full text @ Biochem. Biophys. Res. Commun.