
|
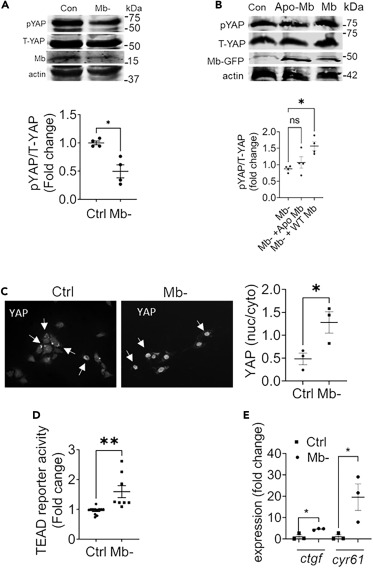
Fig. 2 Myoglobin propagates YAP phosphorylation and inhibits its activity (A) Representative western Blot and quantification of phospho-YAP (pYAP) and total YAP (T-YAP) in control and Mb? cells 48 h after knockdown, quantified as fold change of control; N = 4. (B) Representative western blot and quantitation of pYAP and T-YAP levels in cells with Mb knockdown (control), followed by overexpression of Mb or Apo-Mb for 48 h using GFP tagged Mb or Apo-Mb plasmid. N = 4. (C) Representative immunofluorescence images depicting YAP cellular localization in control and Mb? H9C2 cells. Arrows point to instance of cytoplasmic signal (Ctrl) and nuclear signal (Mb? image). Quantification is the ratio of nuclear to cytoplasmic staining intensity of YAP from 6 high-power field per sample; N = 3. Scale bar: 100 ?m. (D) TEAD-luciferase reporter signal in Mb? expressed as fold change of control cells; N = 3. (E) Fold change over control in relative mRNA expression of YAP transcriptional target genes -ctgf and cyr61-in control and Mb? cells; N = 3. Data are mean � SEM. ?p < 0.05, ??p < 0.01, n.s. = not significant.