IMAGE

Fig. 4

ID
ZDB-IMAGE-240422-45
Source
Figures for Brañas Casas et al., 2024
Image
Figure Caption

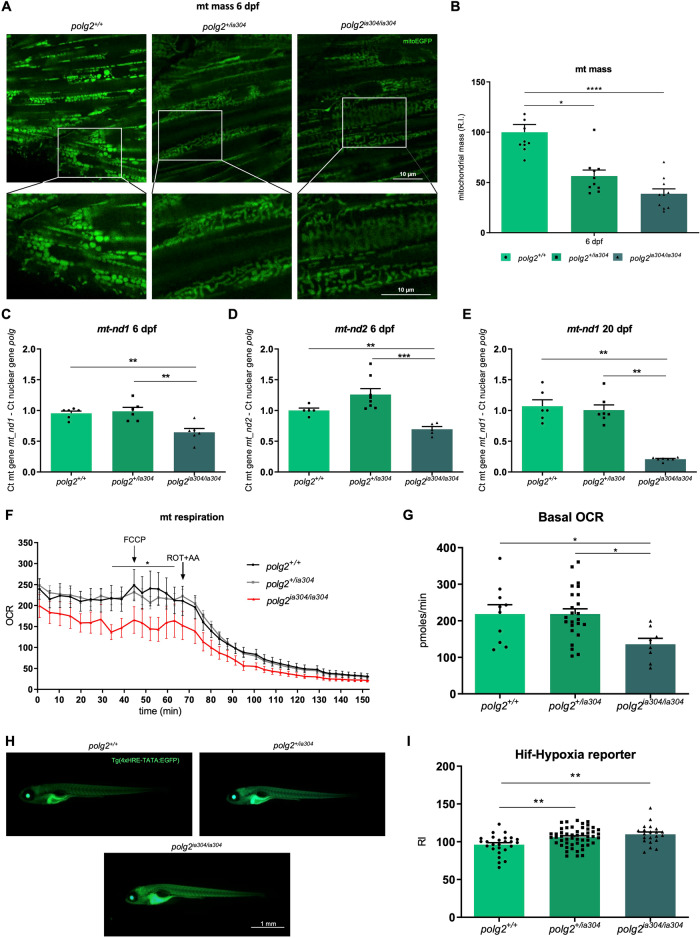
Fig. 4 Defects in mitochondrial content, morphology and metabolism under polg2 KO.

A Confocal images of the Tg(Hsa.Cox8a:MLS-EGFP)ia301 mitochondrial marker (mito:EGFP) in polg2+/+, polg2+/ia304 and polg2ia304/ia304 zebrafish at 6 dpf. Scale bar: 10 µm. B Relative quantification of the mito:EGFP transgene at 6 dpf. Data are reported as mean ± SEM. Statistics were assessed using the Kruskal-Wallis test followed by Dunn’s multiple comparison test; *p < 0.05; ****p < 0.0001; n = 10 independent larvae per condition. Comparison of relative abundances of the mitochondrial nd1 (C) and nd2 (D) genes in wt (polg2+/+), heterozygous (polg2+/ia304) and homozygous (polg2ia304/ia304) zebrafish at 6 dpf. Values are shown as mean ± SEM. Ordinary one-way ANOVA (C) or Games-Howell’s multiple comparison test (D) were applied for statistics; **p < 0.005; ***p < 0.001; Cpolg2+/+ (n = 6 × 10-larva pools), polg2+/ia304 (n = 6 × 10-larva pools), polg2ia304/ia304 (n = 6 × 10-larva pools); (D) polg2+/+ (n = 5 × 10-larva pools), polg2+/ia304 (n = 8 × 10-larva pools), polg2ia304/ia304 (n = 5 × 10-larva pools) from 3 independent biological replicates. E Analysis of the nd1 gene at 20 dpf. Values are reported as mean ± SEM. For statistical analysis, the Kruskal-Wallis test corrected with Dunn’s multiple comparison test was used; **p < 0.005; polg2+/+ (n = 6), polg2+/ia304 (n = 7), polg2ia304/ia304 (n = 7) from 3 independent experiments. F Diagram depicting the oxygen consumption rate (OCR) profile by Seahorse assay in 4 dpf wt (polg2+/+), heterozygous (polg2+/ia304) and homozygous (polg2ia304/ia304) larvae under basal conditions, FCCP (carbonyl cyanide-p-trifluoromethoxyphenylhydrazone)-induced maximal respiratory capacity stimulation and ROT/AA (Rotenone/Antimycin A)-mediated inhibition. Two-way ANOVA followed by Tukey’s multiple comparison test was applied for statistical significance; *p < 0.05 between polg2+/+ and polg2ia304/ia304 individuals. G Quantification of basal OCR in 4 dpf zebrafish. Data are shown as mean ± SEM and were analysed by ordinary one-way ANOVA; *p < 0.05; polg2+/+ (n = 9), polg2+/ia304 (n = 24), polg2ia304/ia304 (n = 8) from 3 independent replicates. H Imaging of HRE:EGFP (Hif-hypoxia) reporter at 6 dpf: an example of wt (above, left), heterozygous (above, right) and homozygous (below) mutant larva. Scale bar: 1 mm. I Integrated density analysis of Hif-hypoxia signalling activation in 6-dpf wt (polg2+/+), heterozygous (polg2+/ia304) and homozygous (polg2ia304/ia304) larvae. Values are expressed as mean ± SEM and analysed by ordinary one-way ANOVA; **p < 0.005; polg2+/+ (n = 6), polg2+/ia304 (n = 26), polg2+/ia304 (n = 52), polg2ia304/ia304 (n = 21), coming from 3 independent experiments.

Acknowledgments
This image is the copyrighted work of the attributed author or publisher, and ZFIN has permission only to display this image to its users. Additional permissions should be obtained from the applicable author or publisher of the image. Full text @ Cell Death Dis.