IMAGE

Figure 3

ID
ZDB-IMAGE-240415-125
Source
Figures for Portolés et al., 2024
Image
Figure Caption

Figure 3

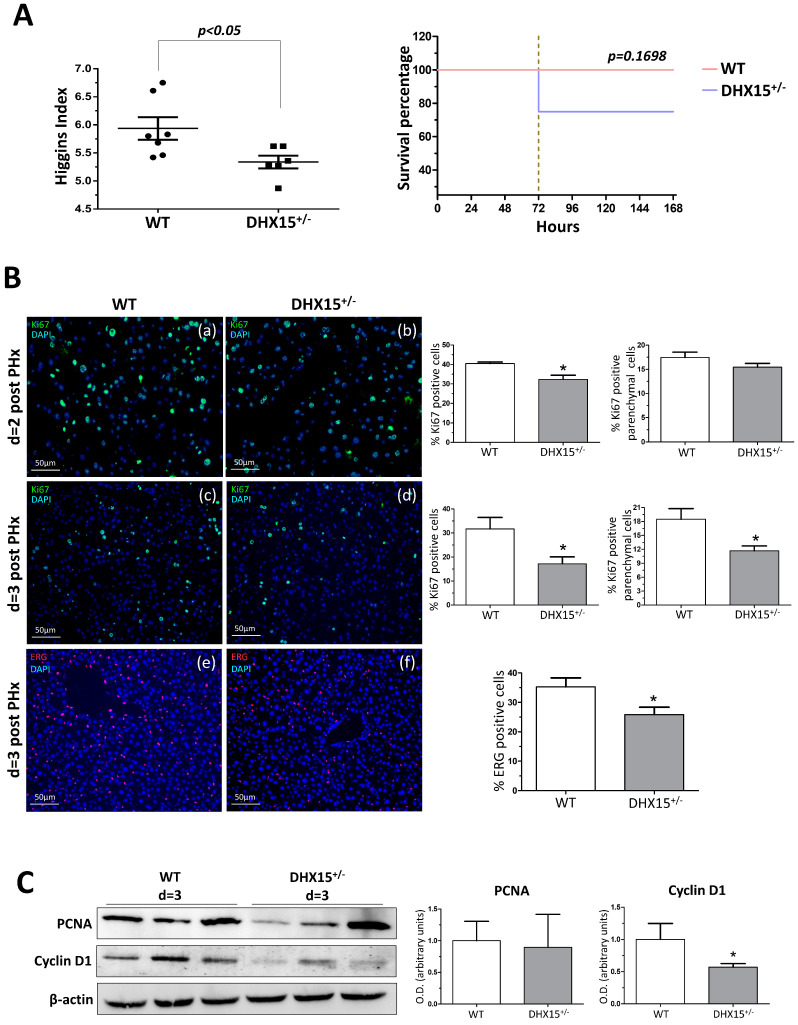
Dhx15 genetic deficiency impaired liver regeneration in mice after PHx. (A) On the left graph, hepatic regenerative index (liver weight/total body weight) obtained in WT and Dhx15+/− mice 7 days after PHx. On the right graph, survival curves from WT and Dhx15+/− mice after PHx generated using the product limit method of Kaplan and Meier. Survival curves were compared using the log-rank test. (B) In the upper panels, representative merged images of immunofluorescence staining of Ki67-positive cells (green) and DAPI (blue) in WT and Dhx15+/− livers at 2 (panels a and b) and 3 (panels c and d) days following PHx. In the lower panels (e and f) are representative merged images of immunofluorescence staining of Erg-positive cells (red) and DAPI (blue) in WT and Dhx15+/− livers at 3 days following PHx. Original magnification ×200. The graph shows the computer-assisted quantification of Ki67 and Erg-positive cells/total nuclei at different times following PHx. We differentiated hepatocytes from the rest of the nonparenchymal cells stained positively for Ki67 by the exclusion of smaller nuclear size with the ImageJ software (version 1.53t). Bars represent mean ± SEM, * p < 0.05 vs. wild-type (n = 4). (C) Expression of Pcna and Cyclin d1 proteins was evaluated by Western blot using liver tissue lysates from wild-type and Dhx15+/− mice 3 days after PHx. β-actin was used as a loading control. Densitometric analysis of protein expression is shown on the bar graph. Bars represent mean ± SEM, * p < 0.05 vs. wild-type (n = 3).

Acknowledgments
This image is the copyrighted work of the attributed author or publisher, and ZFIN has permission only to display this image to its users. Additional permissions should be obtained from the applicable author or publisher of the image. Full text @ Int. J. Mol. Sci.