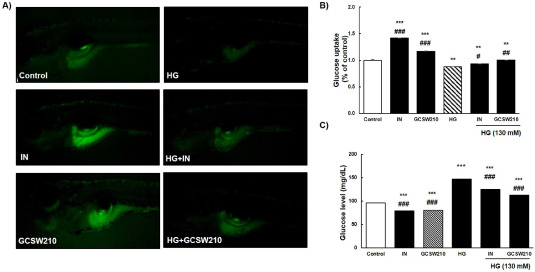
Fig. 3 Effect of GCSW210 on insulin sensitivity in HG-mediated insulin resistance model of zebrafish larvae. A) fluorescence imaging of glucose uptake (4.0X); B) level of glucose uptake; C) glucose level. Zebrafish larvae were exposed to d-glucose solution (130 mM) for 72 h starting 5 dpf to induce IR, followed by treatment with GCSW210 (250 ?g/mL) for 24 h before determining glucose uptake. IN 100 nM was used as positive control. Data are presented as mean ± SE (n = 8) and analyzed by one-way analysis of variance. ?p < 0.05, ??p < 0.01, ???p < 0.001 vs control; #p < 0.05, ##p < 0.01, ###p < 0.001 vs high glucose (HG) group. Abbreviations: IN; insulin, IR; insulin resistance.
Image
Figure Caption
Acknowledgments
This image is the copyrighted work of the attributed author or publisher, and
ZFIN has permission only to display this image to its users.
Additional permissions should be obtained from the applicable author or publisher of the image.
Full text @ J Tradit Complement Med

