
|
Figure 4
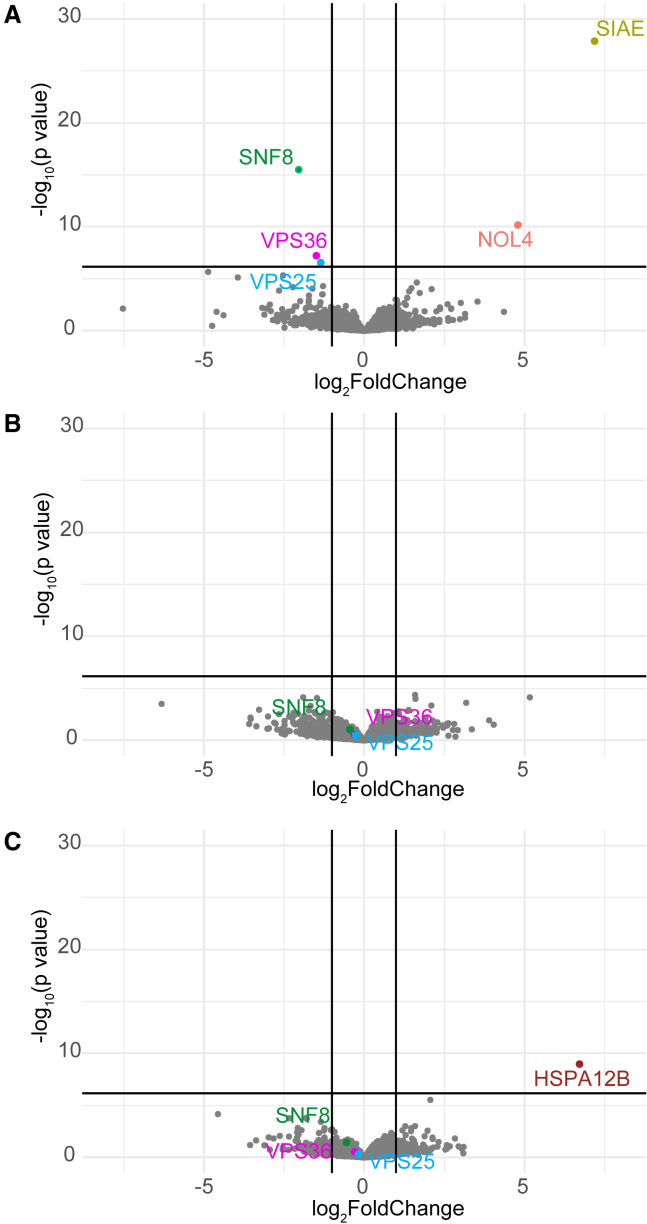
Effects of bi-allelic variants in
Volcano plot of the proteomics analysis performed on cultured fibroblasts from individual A2 (A), D1 (B), and E1 (C). SNF8, VPS25, VPS36, and proteins with statistically different levels are highlighted in color. Vertical black lines indicate log2fold changes of −1 and 1. Horizontal black lines depict significance level of p = 7.14 × 10⁻⁶ (Bonferroni correction for 7,000 hypotheses representing the number of proteins identified). Note the significant reduced protein levels of ESCRT II complex subunits SNF8, VPS25, and VPS36 for individual A2.