
|
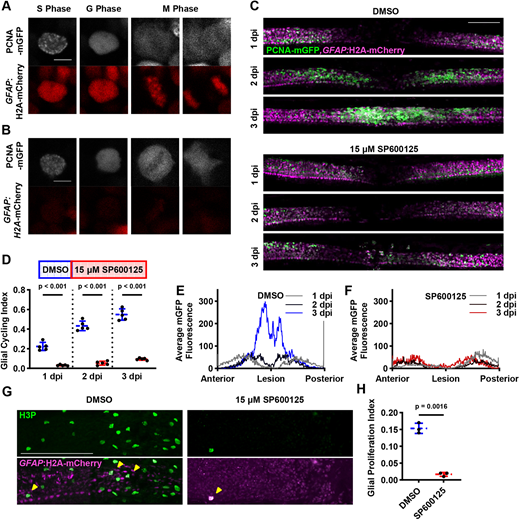
Fig. 6 JNK activity is required for GFAP+ cell cycling during larval spinal cord regeneration. (A) PCNA-mGFP distribution is predictive of mitosis in GFAP+ cells. Cells exhibit characteristic patterns, which allows us to identify S phase (speckling), G phase and M phase in live animals over time. Scale bar: 5 �m. (B) PCNA-mGFP distribution is also predictive of mitosis in GFAP? cells. Scale bar: 5 �m. (C) PCNA-mGFP pattern in vehicle- and JNK inhibitor-treated animals during spinal cord regeneration. Maximum intensity projections are shown with a GFAP:H2A-mCherry-derived mask applied to the EGFP channel to filter out GFAP? PCNA+ cells. The same animal is shown for each condition at different time points during regeneration. Scale bar: 100 �m. (D) JNK inhibition results in demonstrably lower glial cell cycling at 1-3 dpi during spinal cord regeneration (n=6 animals across two experiments; two-tailed t-test with Welch's correction). (E) PCNA-mGFP localization during regeneration in glia of DMSO-treated animals. At 1 dpi, PCNA-mGFP is expressed on either side of the lesion site. By 3 dpi there is a large increase in PCNA-mGFP signal in the lesion site itself. Each line represents the average PCNA-mGFP fluorescence values thresholded by GFAP:H2A-mCherry and binned along the AP axis for each indicated time point (n=6 animals across two experiments). (F) PCNA-mGFP localization during regeneration in glia of SP600125-treated animals. At 1 dpi, there is a modest peak of PCNA-mGFP fluorescence to the posterior side of the lesion, but broadly lower expression than in DMSO-treated controls. This localization is similar at later time points, even after SP600125 treatment has ceased. Each line represents the average of PCNA-mGFP fluorescence values thresholded by GFAP:H2A-mCherry and binned along the AP axis for each indicated time point (n=6 animals across two experiments). (G) Mitotic glia marked by immunofluorescence for H3P and GFAP:H2A-mCherry native fluorescence after SPI. Maximum intensity projections are shown, including GFAP? tissue around the spinal cord, which also contains H3P+ cells. Yellow arrowheads indicate GFAP+H3P+ cells. Scale bar: 100 �m. (H) Measurably fewer GFAP+/H3P+ cells are present in injured spinal cords after SP600125 treatment (n=6 animals across two experiments; two-tailed t-test with Welch's correction).