
Image
|
Figure Caption
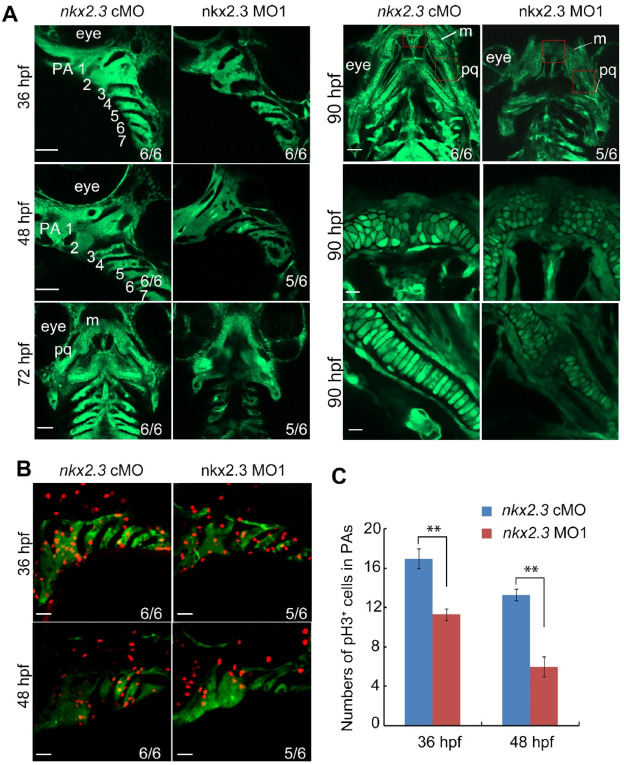
Fig. 4 Proliferation of CNCCs is compromised in nkx2.3 morphants. (A) Time-lapse imaging of nkx2.3 morphants and control embryos in Tg(fli1-GFP) from 36 to 90hpf. The bottom right is an enlarged view of the red box in the top right figure at 90 hpf. Scale bars: 20 ?m. (B) Immunostaining of embryos in the background of Tg(fli1:GFP) with pH3 at indicated stages. Scale bars: 20 ?m. (C) The number of pH3 and GFP double-positive cells in the pharyngeal arches. Data are represented as mean � SD. **P < 0.01.
Figure Data
Acknowledgments
This image is the copyrighted work of the attributed author or publisher, and
ZFIN has permission only to display this image to its users.
Additional permissions should be obtained from the applicable author or publisher of the image.
Full text @ Heliyon