
|
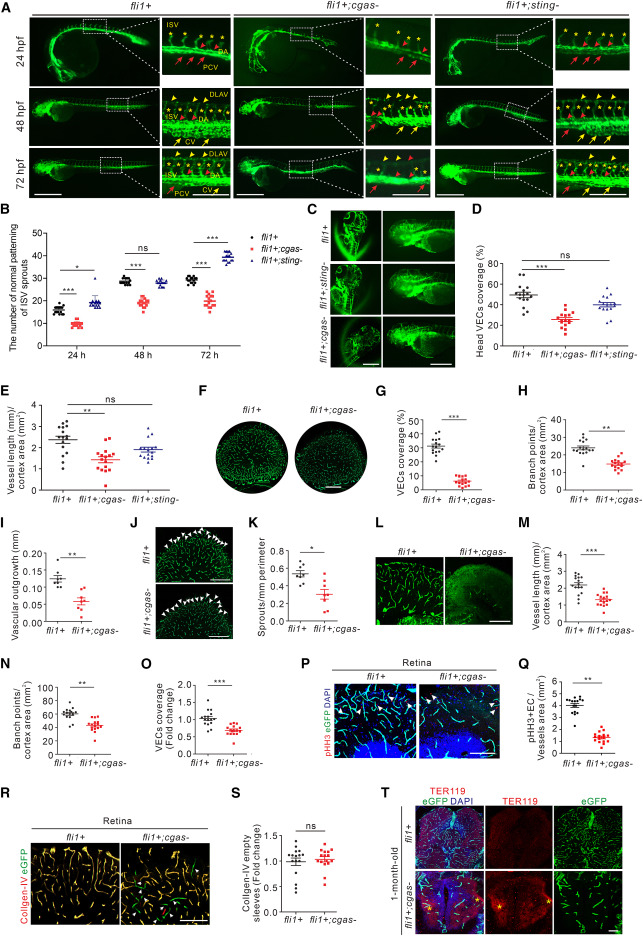
Fig. 1 The absence of cGAS results in vascular defects in zebrafish (A and B) Representative images (A) and quantification (B) of the number of normal patterning of ISV sprouts in Tg(fli1a:eGFP);cgas?/?, Tg(fli1a:eGFP);sting?/?, and Tg(fli1a:eGFP) larvae at 24, 48, and 72 hpf (n = 16/group). Scale bars, 500 ?m (lower magnification) and 200 ?m (insets). (C?E) Representative images of vasculatures from brain tissues (C) and quantification of vascular coverage (D) and vessel length (E) in 72 hpf Tg(fli1a:eGFP);cgas?/?, Tg(fli1a:eGFP);sting?/?, and Tg(fli1a:eGFP) larvae (n = 16/group). Scale bar, 200 ?m. (F?I) Representative images of vasculatures (F) and quantification of vascular coverage (G, n = 16/group), branch points (H, n = 16/group), and radial outgrowth (I, n = 8/group) in retinal tissues from 1-month-old Tg(fli1a:eGFP);cgas?/? and Tg(fli1a:eGFP) fish. Scale bar, 100 ?m. (J and K) Representative images (J) and quantification (K) of the number of sprouts (arrowheads) at vascular front of retinal lobe in 1-month-old Tg(fli1a:eGFP);cgas?/? and Tg(fli1a:eGFP) fish (n = 8/group). Scale bar, 50 ?m. (L?O) Representative images (L) and quantification of the total vessel length (M), number of branch points (N), and vascular coverage (O) in brain cortical vasculature of 1-month-old Tg(fli1a:eGFP);cgas?/? and Tg(fli1a:eGFP) fish (n = 16/group). Scale bar, 50 ?m. (P and Q) Immunofluorescence (P) and comparison (Q) of VECs (red, arrowheads) in retinal tissues from 1-month-old Tg(fli1a:eGFP);cgas?/? and Tg(fli1a:eGFP) fish (n = 16/group). Scale bar, 20 ?m. (R and S) Immunofluorescence (R) and quantification (S) of the number of collagen-IV-negative VECs (green, arrowheads) in collagen-IV-stained (red) retinal tissues from 1-month-old Tg(fli1a:eGFP);cgas?/? and Tg(fli1a:eGFP) fish (n = 16/group). Scale bar, 20 ?m. (T) Immunofluorescence of erythroid cells (red) showing the potential hemorrhages (asterisks) in brain tissues from 1-month-old Tg(fli1a:eGFP);cgas?/? and Tg(fli1a:eGFP) fish. Scale bar, 100 ?m. Data are represented as means � SEM. ANOVA in (B), (D), (E), Student?s t test in (G?I), (K), (M?O), (Q), and (S). ?p < 0.05; ??p < 0.01; ???p < 0.001; ns, not significant. See also Figure S1.