IMAGE

Figure 3.

ID
ZDB-IMAGE-240108-20
Source
Figures for Mbarek et al., 2023
Image
Figure Caption

Figure 3.

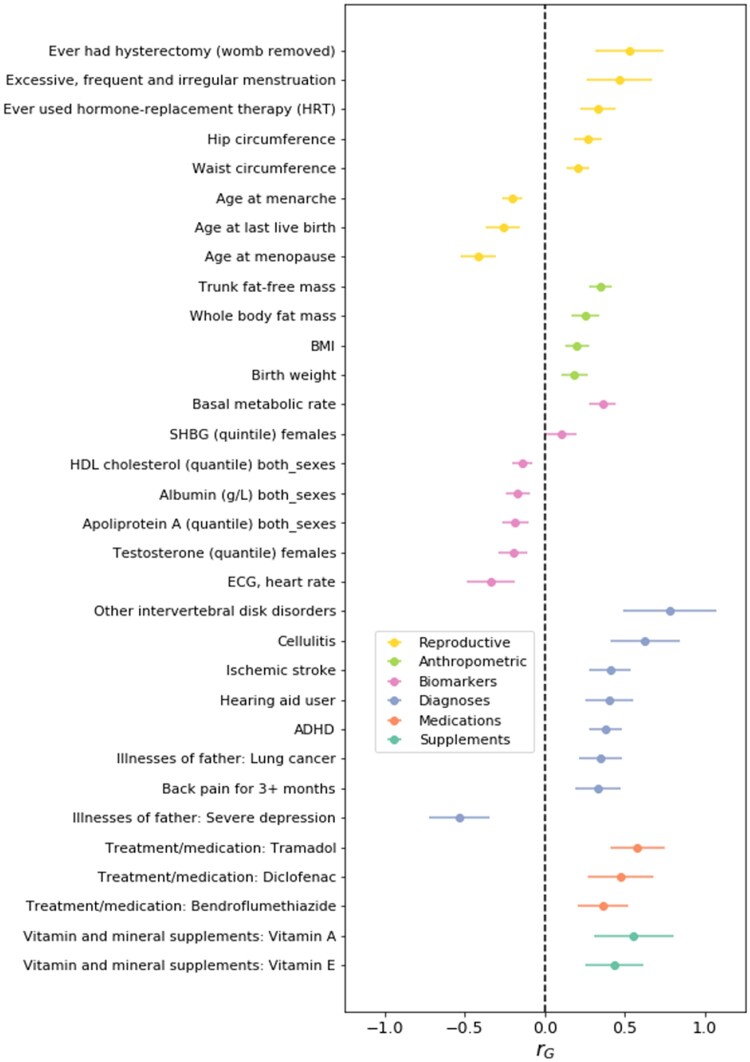
Genetic relationships between the genome wide association study (GWAS) meta-analysis results of dizygotic (DZ) twinning and 28 other traits. Single nucleotide polymorphism (SNP)-based genetic correlations (rg) were estimated with linkage disequilibrium (LD) score regression. The bars represent the standard error of rg. The genetic correlation estimates are colour-coded by trait category. BMI, body mass index; SHBG, sex hormone binding globulin; HDL, high-density lipoprotein; ECG, electrocardiogram; ADHD, attention deficit hyperactivity disorder.

Acknowledgments
This image is the copyrighted work of the attributed author or publisher, and ZFIN has permission only to display this image to its users. Additional permissions should be obtained from the applicable author or publisher of the image. Full text @ Hum. Reprod.