IMAGE

Fig. 7.

ID
ZDB-IMAGE-231220-55
Source
Figures for Nagorska et al., 2023
Image
Figure Caption

Fig. 7.

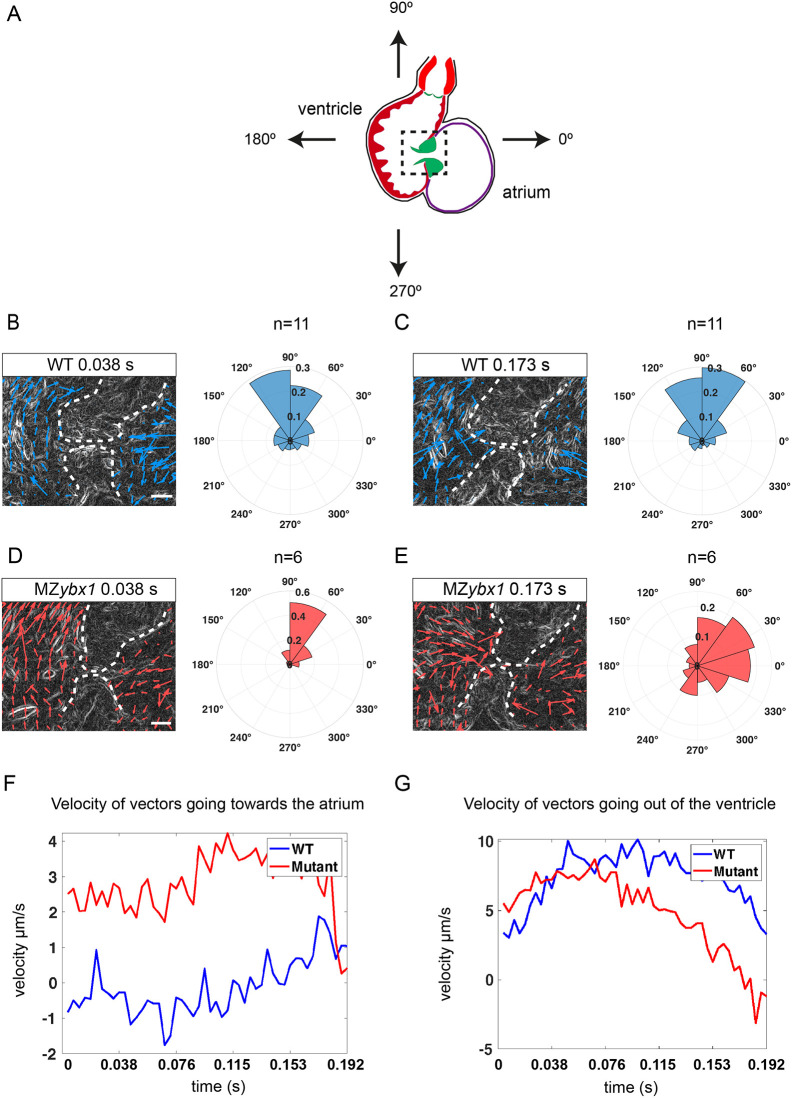
Mutant ybx1 embryos have retrograde blood flow at 5 dpf. (A) Schematic of a zebrafish heart at 5 dpf. Arrows indicate the directions of flow; black box shows the region analysed in PIV. (B) Representative image of a wild-type (WT) embryo, showing PIV application at 0.038 s of ventricular systole. Vectors generated from red blood cells are shown as blue arrows. Rose plot shows quantification of direction of the blood flow at 0.038 s for the imaged wild-type hearts (n=11). Scale bar: 25 µm. (C) A PIV image of wild-type ventricular contraction at 0.173 s (left) and quantification of direction of generated vectors (rose plot on right) (n=11). Vectors are shown as blue arrows. Scale bar: 25 µm (bars in B,D apply to C,E, respectively). (D) A PIV image showing the direction of blood flow in MZybx1 embryos with retrograde blood flow at 0.038 s. Vectors are shown as red arrows. Rose plot shows analysis of direction of blood flow in MZybx1 embryos with retrograde blood flow (n=6). Scale bar: 25 µm. (E) PIV analysis at 0.173 s of ventricular systole and quantification of vector direction in ybx1 embryos with retrograde blood flow at 0.173 s (n=6). Vectors are shown as red arrows. Scale bar: 25 µm. Dashed lines in B-E delineate heart valves. (F) Analysis of average velocity of horizontal vectors moving towards the atrium over the duration of ventricular contraction. Wild-type embryos are shown in blue and ybx1 mutants in red. (G) Analysis of average velocity of vertical vectors moving out of the ventricle during ventricular contraction. Wild-type embryos in blue and ybx1 mutants in red.

Figure Data
Acknowledgments
This image is the copyrighted work of the attributed author or publisher, and ZFIN has permission only to display this image to its users. Additional permissions should be obtained from the applicable author or publisher of the image. Full text @ Development