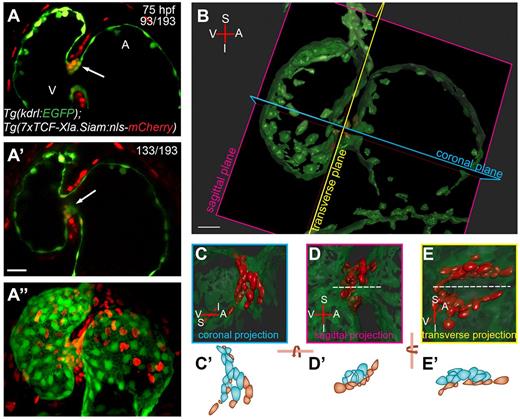
Fig. 1 3D analysis of cardiac valve formation. (A-A?) z-stack of a 75 hpf Tg(kdrl:EGFP);Tg(7xTCF-Xla.Siam:nls-mcherry) heart; ventral view. Coexpression of endothelial-specific EGFP and TCF-driven mCherry marks the valve-forming cells in the single-plane images. Coexpression marking the superior part of the AVC is shown in z-stack plane 93 (A, arrow) and colocalization marking the inferior part of the AVC is shown in z-stack plane 133 (A?, arrow). Maximum projection of the z-stack is shown in A?. (B) 3D volume rendering of dataset from A. Note that Imaris software was used to remove the mCherry signal not co-occurring or overlapping with EGFP, so that only endocardial mCherry+ cells are shown. The coronal, sagittal and transverse planes of the heart were defined based on the orientation of the linear heart tube. (C-E) Close ups of the 3D volume rendered views in coronal, sagittal and transverse projections, respectively. The superior immature valve is above the dashed line in D and E. (C?,D?,E?) Cartoons of TCF:mCherry+ endocardial cells of the superior half of the AVC. Cells colored in blue represent abluminal cells (ALCs) and cells colored in reddish brown represent luminal cells (LCs). A, atrium; I, inferior AVC; S, superior AVC; V, ventricle. Scale bar: 20 Ám.
Image
Figure Caption
Acknowledgments
This image is the copyrighted work of the attributed author or publisher, and
ZFIN has permission only to display this image to its users.
Additional permissions should be obtained from the applicable author or publisher of the image.
Full text @ Development

