
Image
|
Figure Caption
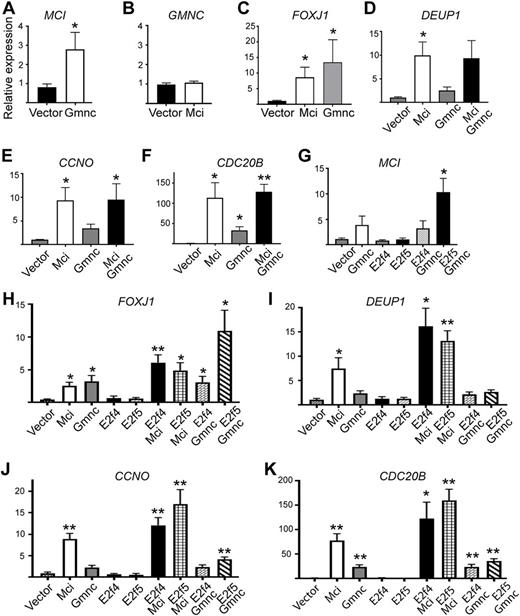
Fig. 6 RT-qPCR analysis of ciliary transcription factor and DD pathway gene expression levels in response to overexpression of MCI, GMNC and E2F proteins in HEK293T cells. (A-K) Relative expression levels are plotted on the y-axis; overexpression conditions are indicated on the x-axis. Data are mean�s.e.m. Analysis was carried out on three independent biological replicates. *P?0.05, **P?0.01.
Acknowledgments
This image is the copyrighted work of the attributed author or publisher, and
ZFIN has permission only to display this image to its users.
Additional permissions should be obtained from the applicable author or publisher of the image.
Full text @ Development