
Fig. 4
|
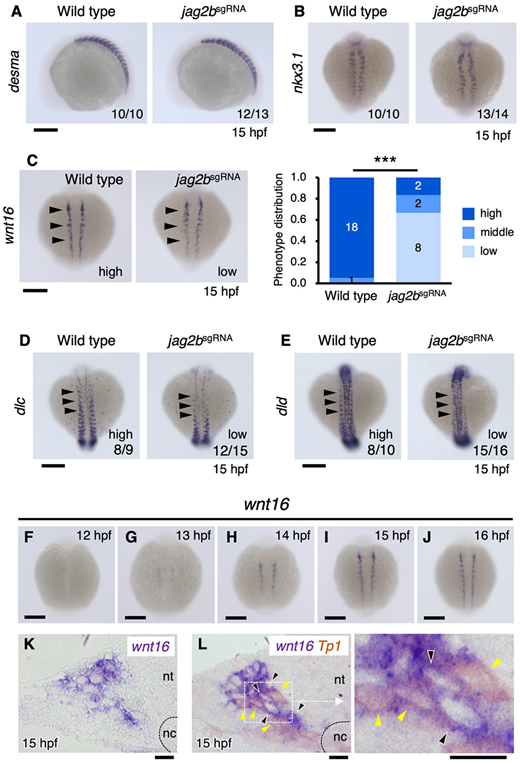
Fig. 4 jag2bsgRNA embryos showed reduced wnt16 expression in the somites. (A,B) Expression of desma (a somite marker) and nkx3-1 (a sclerotome marker) in wild-type and jag2bsgRNA embryos. (C) Expression of wnt16 in wild-type and jag2bsgRNA embryos. Graph shows the distribution of embryos exhibiting ?high?, ?middle? or ?low? runx1 expression phenotypes. ***P<0.001. (D,E) Expression of dlc and dld in wild-type and jag2bsgRNA embryos. Black arrowheads denote dlc or dld expression in the somite. (F-J) Time course of wnt16 expression in wild-type embryos. (K,L) Expression of wnt16 or both wnt16 and Tp1:GFP in the somites at 15 hpf. A high-magnification view of the boxed region in L is shown to the right. Black and yellow arrowheads indicate wnt16- and Tp1:GFP-expressing cells, respectively. Scale bars: 200 ?m (A-J); 10 ?m (K,L).