IMAGE

Fig. 3.

ID
ZDB-IMAGE-231212-60
Source
Figures for Karoglu-Eravsar et al., 2023
Image
Figure Caption

Fig. 3.

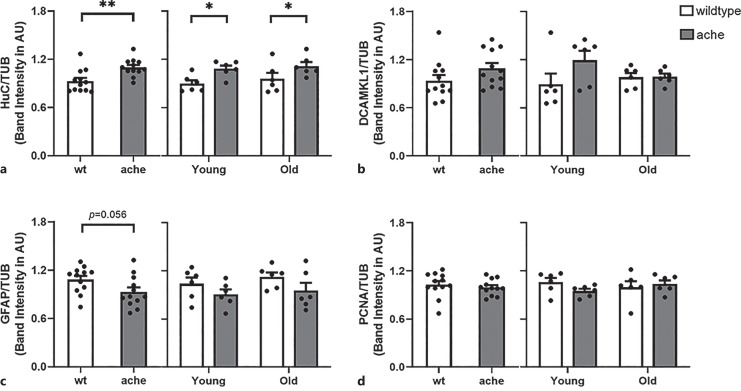
Relative levels of neuronal, glial, and proliferation markers between genotype and age groups. a HuC protein expression levels were altered significantly depending on the genotype of the animal with ache mutants having higher levels of HuC at both young and old ages. b No significant changes were observed in the whole brain levels of the post-mitotic neuronal marker DCAMKL1. c Glial marker GFAP showed no significant changes. d Global proliferation marker PCNA was stable among age and genotype groups. The group means + SE are represented. *: p <0.05, **: p <0.01.

Acknowledgments
This image is the copyrighted work of the attributed author or publisher, and ZFIN has permission only to display this image to its users. Additional permissions should be obtained from the applicable author or publisher of the image. Full text @ Gerontology