IMAGE

Fig. 6

ID
ZDB-IMAGE-231208-52
Source
Figures for Yang et al., 2023
Image
Figure Caption

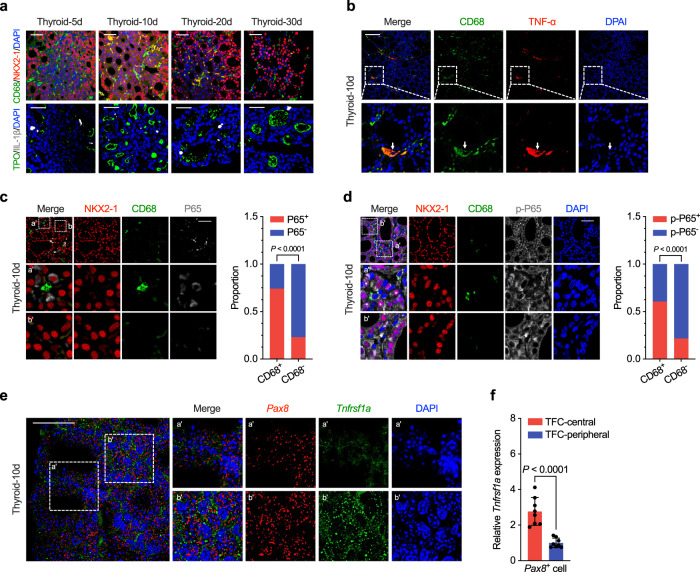
Fig. 6 Myeloid cells secrete Tnf-α to promote NF-κB activation in mice thyroid epithelial cells.

a The CD68 and Il-1β positive cells were identified in thyroid tissues of postnatal day 5, 10, 20, 30 mice by IF. b Representative images of IF analysis showing Tnf-α expression in CD68 positive macrophages (arrowheads) at postnatal day 10 mice thyroid tissues. Representative image and statistical analysis showing CD68-positive macrophages located near the P65 (c) or nuclear phosphorylated P65 (d) positive thyrocytes in thyroid tissues at postnatal day 10 mice by polychromatic immunofluorescence analysis. e Representative image showing the multi-color RNA scope analysis of Pax8 and Tnfrsf1a in postnatal day 10 mouse thyroid gland. The areas framed by the two white dashed lines correspond to the peripheral (a’, mature lumen has been established) and central (b’, immature solid mass appearance) of thyroid tissue, which are shown on the right. f Statistical assessment of the relative fluorescence intensity of Tnfrsf1a in the thyrocytes located in the central or peripheral thyroid tissues at postnatal day 10 mice. Of the 6 mice thyroid tissues examined, three fields of view for each were randomly selected for calculation the mean fluorescence intensity (divided by the number of cells) of Tnfrsf1a in the peripheral and central thyrocytes, respectively. Data are shown as mean ± SD, and and statistical significance was determined by Two-sided Student’s t test (f). Scale bar, 50 μm. Three independent experiments were carried for (a and b). For the statistical analysis in (c and d), 70 areas were randomly chosen under confocal microscopy from the slices of 7 postnatal day 10 mice thyroid tissues (10 areas for each), the areas were classified into two groups by whether CD68 positive cells existed. The presence of P65 (c) or nuclear phosphorylated P65 (d) positive cells or not in each group were summed respectively. Two-sided Fisher’s exact test to calculate the P value. Source data are provided as a Source data file.

Acknowledgments
This image is the copyrighted work of the attributed author or publisher, and ZFIN has permission only to display this image to its users. Additional permissions should be obtained from the applicable author or publisher of the image. Full text @ Nat. Commun.