IMAGE

Fig. 2

ID
ZDB-IMAGE-231208-48
Source
Figures for Yang et al., 2023
Image
Figure Caption

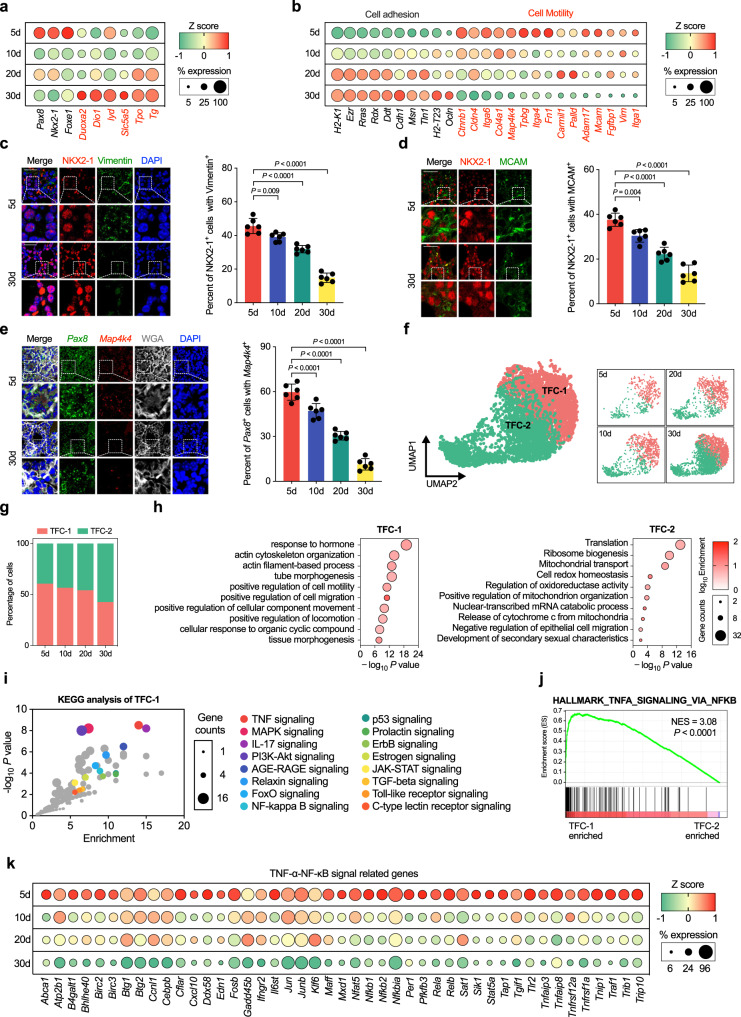
Fig. 2 Identification of motile thyrocytes by scRNA-seq from the developing mice thyroid tissues.

a Dot plot of thyroid specification (marked in black) and function related genes (marked in red) expression in thyrocytes at each time point. b Dot plot of cellular adhesion and motility related genes expressed in thyrocytes at each time point in postnatal mice thyroid tissues (left axis). c Representative images and statistical assessment showing the percentage of Vimentin positive thyrocytes (stained by NKX2-1) from postnatal day 5 to 30 mice thyroid tissues. d Representative images, and statistical assessment showing the MCAM positive thyrocytes in postnatal day 5 and 30 mice thyroid tissues by using IF staining. e Representative images, and statistical assessment of RNA-scope analysis of map4k4 positive thyrocytes (stained by Pax8 as a marker for thyrocyte) from postnatal day 5 to 30 mice thyroid tissues. f UMAP of TFC and split by time point. Cells are colored and annotated by cell subtype. g Bar plot shown the proportion of TFC subtypes among all TFC at each time point examined. h GO enrichment analysis of the DEGs that specifically enriched in TFC-1 and TFC-2 subtype respectively. i KEGG analysis of the DEGs distinguishing the TFC-1 subtypes. j Analysis of “HALLMARK_TNFA_SIGNALING_VIA_NFKB” gene set between TFC-1 and TFC-2 cells by GSEA software, the NES and FDR P value were shown. k Dot plot of TNF-α-NF-κB pathway genes expression in TFC cluster at each time point in postnatal mice thyroid tissues. For (a, b and k), color of dots represents z-scored of the gene expression level, and size of dots represents percent of TFC with at least one UMI detected per gene. In (c, d and e), Scale bar, 50 μm. n = 6 biologically independent samples. Data are shown as mean ± SD. Statistical significance was determined by One-way ANOVA, followed by Tukey’s multiple comparison test. In (h and i), P value was determined by Benjamini-Hochberg-adjusted one-sided hypergeometric test. Source data are provided as a Source data file.

Acknowledgments
This image is the copyrighted work of the attributed author or publisher, and ZFIN has permission only to display this image to its users. Additional permissions should be obtained from the applicable author or publisher of the image. Full text @ Nat. Commun.