
|
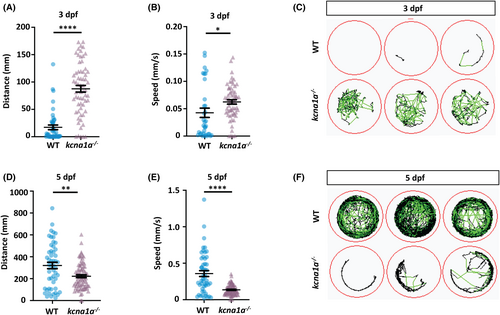
Fig. 2 Spontaneous behavior analysis of kcna1a−/− zebrafish. (A) Quantification of distance traveled at 3 dpf tracked in 100% light for 30 min. kcna1a−/− move higher distances compared to WT. WT, n = 44; kcna1a−/−, n = 63. (B) Quantification of speed at 3 dpf tracked in 100% light for 30 min. Speed of kcna1a−/− is significantly higher than WT. WT, n = 34; kcna1a−/−, n = 60. (C) Locomotor plots at 3 dpf, showing that kcna1a−/− are more active than WTs. WT, n = 20; kcna1a−/−, n = 20. (D) Quantification of distance traveled at 5 dpf tracked in 100% light for 30 min. Distance traveled by kcna1a−/− is significantly reduced compared to WT. WT, n = 51; kcna1a−/−, n = 84. (E) Quantification of speed at 5 dpf tracked in 100% light for 30 min. Speed of kcna1a−/− is significantly reduced compared to WT. WT, n = 50; kcna1a−/−, n = 84. (F) Locomotor plots at 5 dpf, showing that kcna1a−/− are moving less and have abnormal swimming patterns. WT, n = 20; kcna1a−/−, n = 24. Data are mean ± SEM, *p ≤ .05, **p ≤ .01, ****p ≤ .0001- Unpaired t test